Link Analysis Dimension Menus
All the link analysis configurations are available into the Dimension option menus. These menus can be opened by right-clicking on the corresponding dimension button in the left input vertical menu.
Each one of the different dimension buttons opens a different dimension menu. Therefore, we are going to describe them one by one in the next sections.
Link Analysis Layout Options
The Link Analysis options menu controls the set of options which affect the link analysis layout as a whole.
All the options available in the Link Analysis menu can be customized in parametric mode. Once the options have been customized as desired, users need to click APPLY to confirm the changes or CANCEL to discard them.
They differ according to the selected link analysis layout type. Below, you’ll find a list of layout option menus organized by this selection:
Users can find all the available options and the corresponding GOLD references in the table below.
To know more about GOLD, go to the corresponding page.
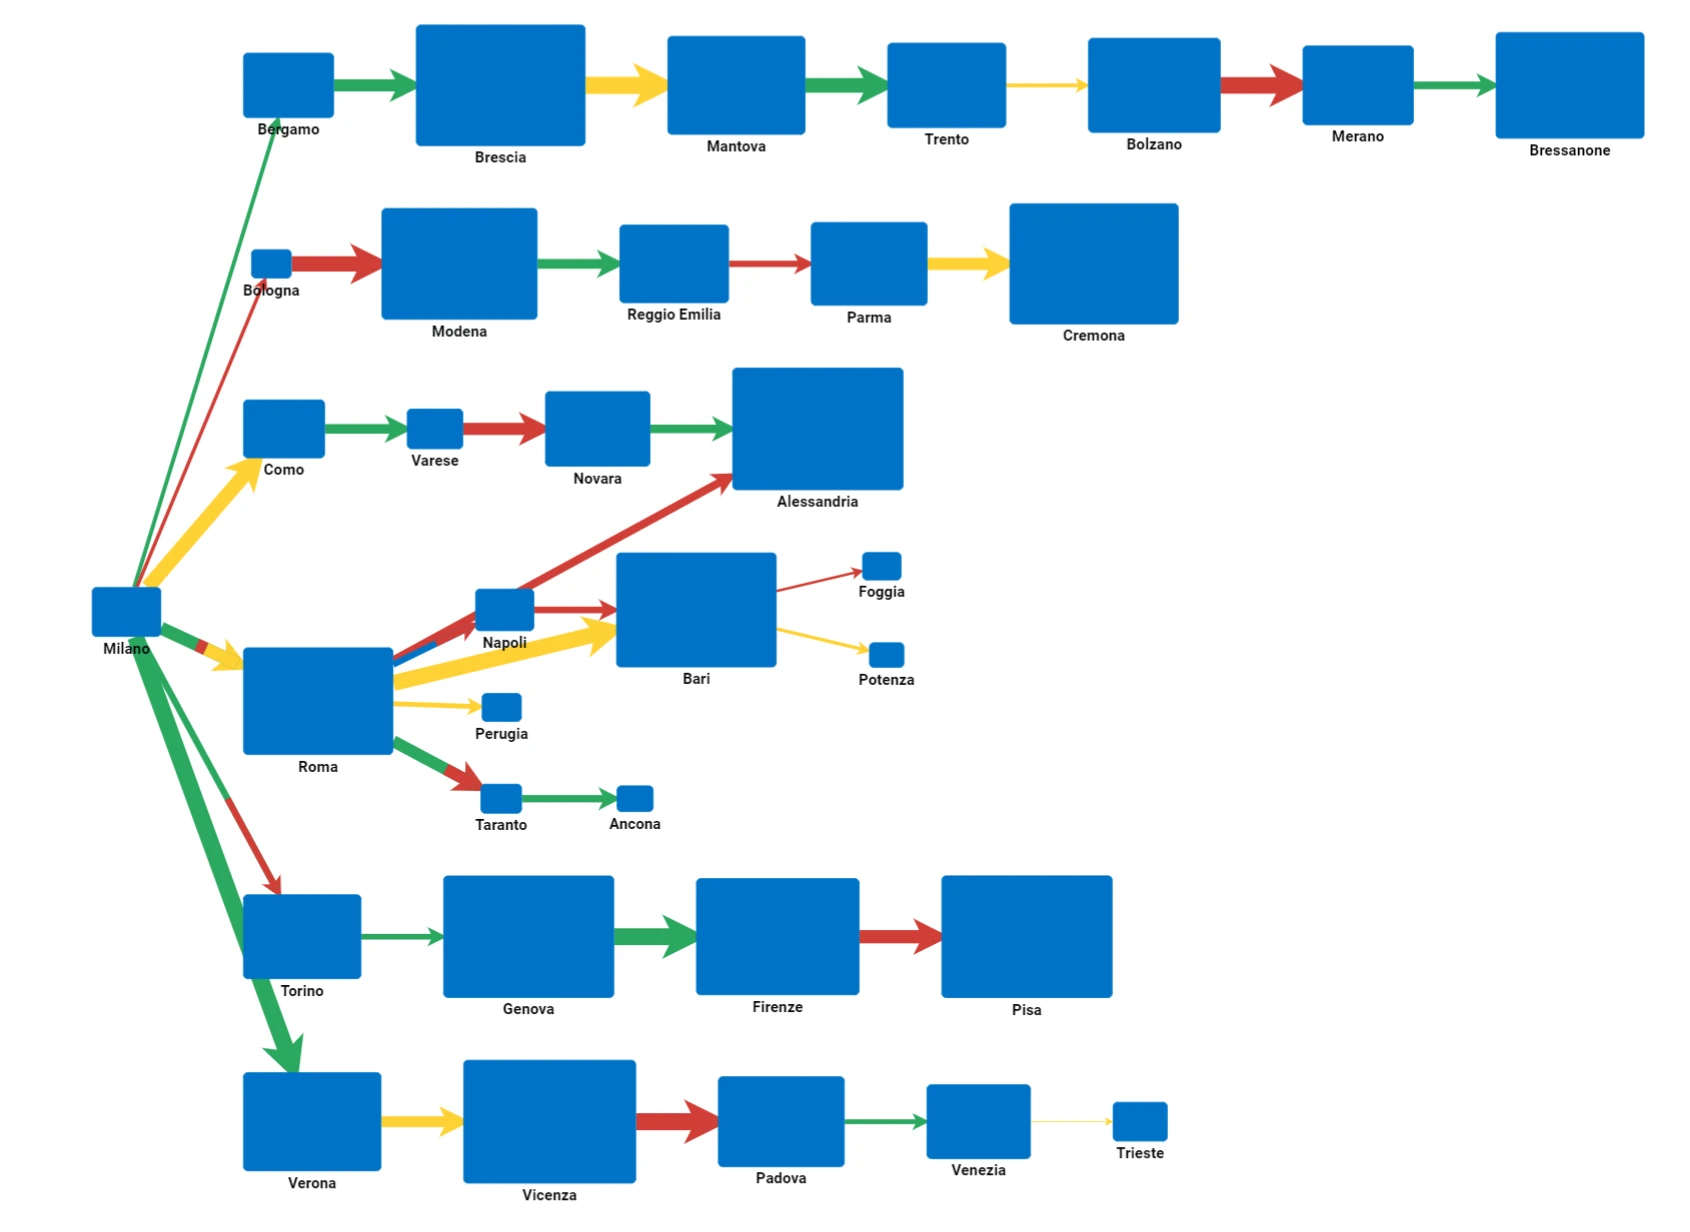
Tree Layout
This type of layout positions nodes and links in a tree-structured graph. In the tree layout, by default all the children of each node are lined up horizontally from left to right.
In the Tree Layout, every child node has a single father node, so there’s a unique path to go back to the root node, and a node cannot have two different roots.
Option |
Description |
GOLD Ref |
|---|---|---|
Layer spacing |
It’s the distance between layers, so between a parent node and its child nodes. |
|
Node spacing |
It’s the distance between nodes within a layer, so between siblings. |
Force Directed Layout
Using the Force Directed Layout you can customize the strength between each node in the graph. In this layout a new dimension is added to the input configuration to allow the user to customize the node attraction or repulsion.
In this new dimension, by using the right-click to open the corresponding options layout panel, users can configure the force type. Possible values are:
Distance: in this configuration links are supposed to be springs applying an elastic force through the data connected to them. The attribute dropped on this dimension is then used to define the rest position of each spring. Spring coefficient is equal for all the links and can be configured from the plot general layout.
Medoid: in this configuration the system is lead to build a solar system layout with a central star (the medoid) and a set of nodes around them. This is obtained by associating an electric charge to each node. This electric charge force nodes with the same sign electric charge to repulse each other, while forces different sign electric charge nodes to be attracted. In the Medoid configuration the attribute is used to select a subset of nodes which are going to become the stars of our final systems. In particular a value needs to be selected to filter all the nodes which have this value for the given attribute. These selected nodes will own a big positive electric charge while the rest of the nodes will own a small negative electric charge.
Firework: in this configuration, the graph is divided in levels according to the distance of each node from the root and the leaf. Each node at the same level has a small electric charge of the same sign while continuous levels own always nodes with different sign charge. The final effect is a fragmentation of the graph very similar to a firework pattern.
In the plot configuration panel you can modify the default value for the electric charge of each node, or the spring default rest length and spring coefficient. Moreover, rest system configuration is found iteratively. Since this operation may reduce performance of the plot refresh maximum number of iteration can be imposed to speed up the plot draw operation. The full list of the available options is reported in the table below:
Option |
Description |
GOLD Ref |
|---|---|---|
Link min length |
It defines the minimum length for a link. |
|
Default electrical charge |
It assigns the electrical charge for all vertexes. |
|
Default spring stiffness |
It assigns the default spring stiffness for all edges. |
|
Default spring length |
It assigns the default spring length for all edges. |
|
Epsilon distance |
It gets or sets approximately how far a node must move in order for the iterations to continue. The default value is 1, and the inserted value must be larger than zero. |
|
Infinity distance |
It gets or sets a threshold for the distance beyond which the electrical charge forces may be ignored. The default value is 1000, and the inserted value must be larger than 1. |
|
Max iterations |
It gets or sets the maximum number of iterations to perform when doing the force-directed auto layout. The value must be non-negative. |
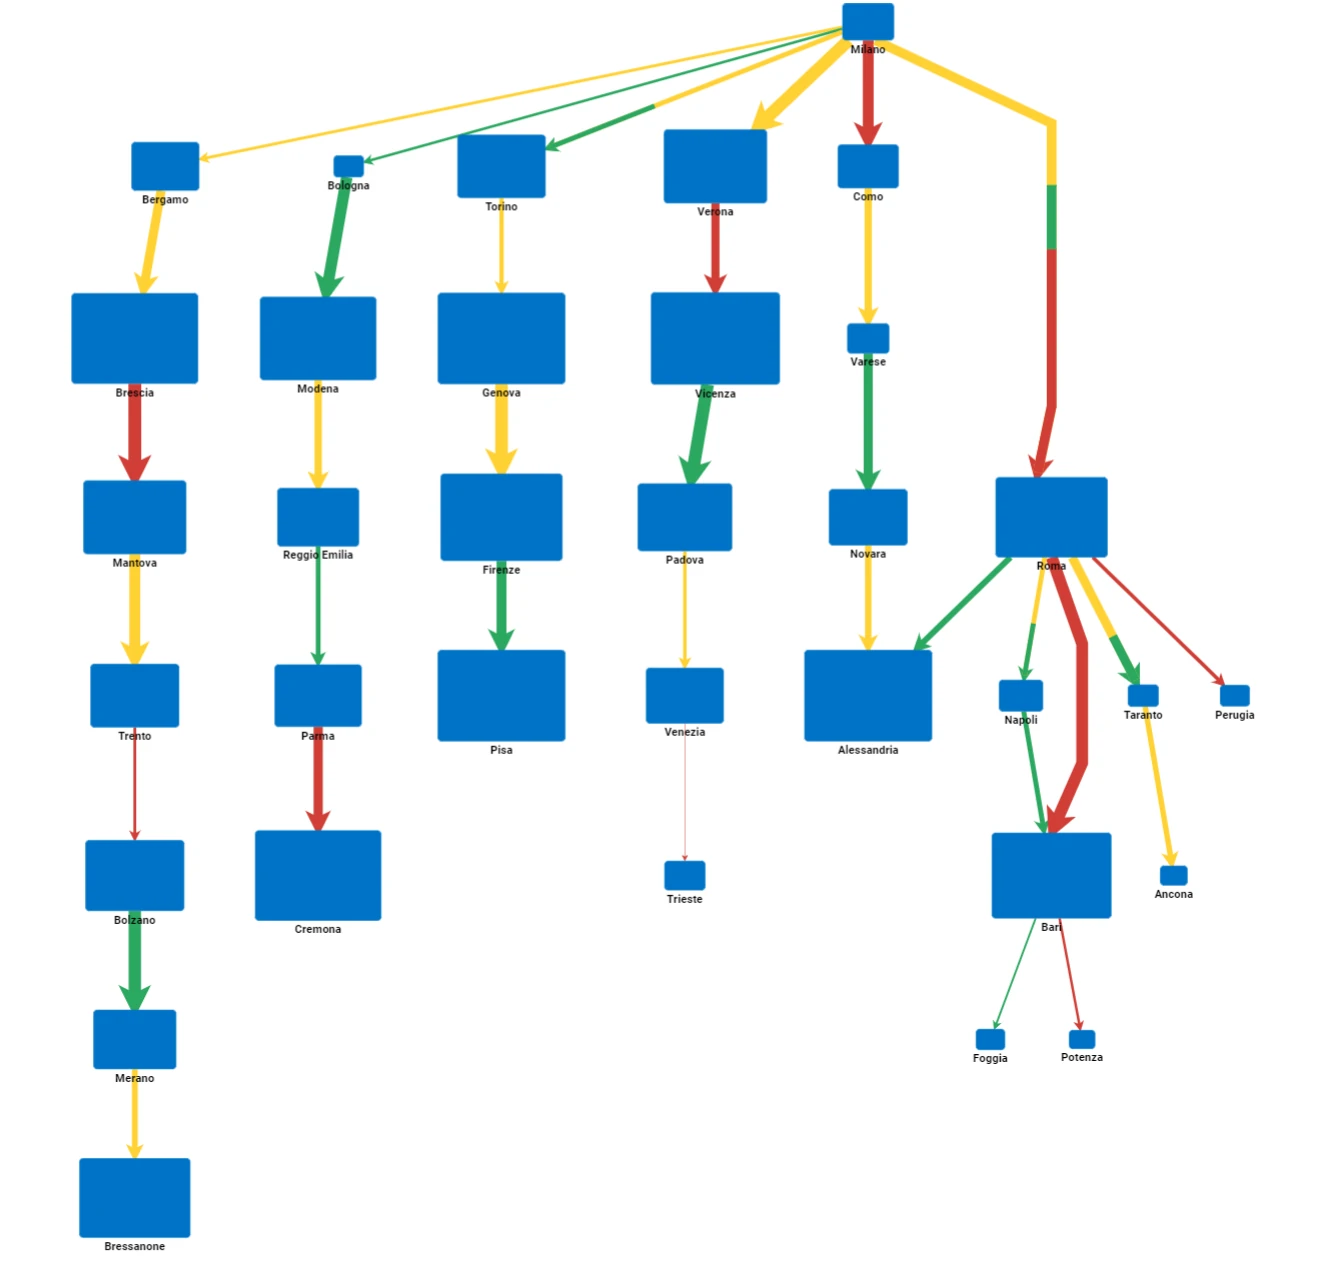
Layered-Digraph Layout
This layout positions nodes and links in a layered digraph structure. This means nodes are still organized in layers as in the Tree layout, but layers can be mixed or skipped according to the more complicated link structure supported.
The layer position of each node is evaluated by calculating the distance from all the roots and from all the leafs and by taking the mode of these values. Each node therefore can have multiple roots, differently from the Tree layout.
Option |
Description |
GOLD Ref |
|---|---|---|
Layer spacing |
It defines the distance between layers. This value must be non-negative. |
|
Column spacing |
It controls the size of each “column”, this affects the distance between nodes within a layer. This value must be positive. |
|
Layering option |
It sets which layering option is being used. Available options are: |
|
Direction |
It sets the direction the graph grows towards. Available options are: |
|
Aggressive option |
It specifies how much effort the Layered Digraph Layout puts into trying to look for link crossings. Available options are: |
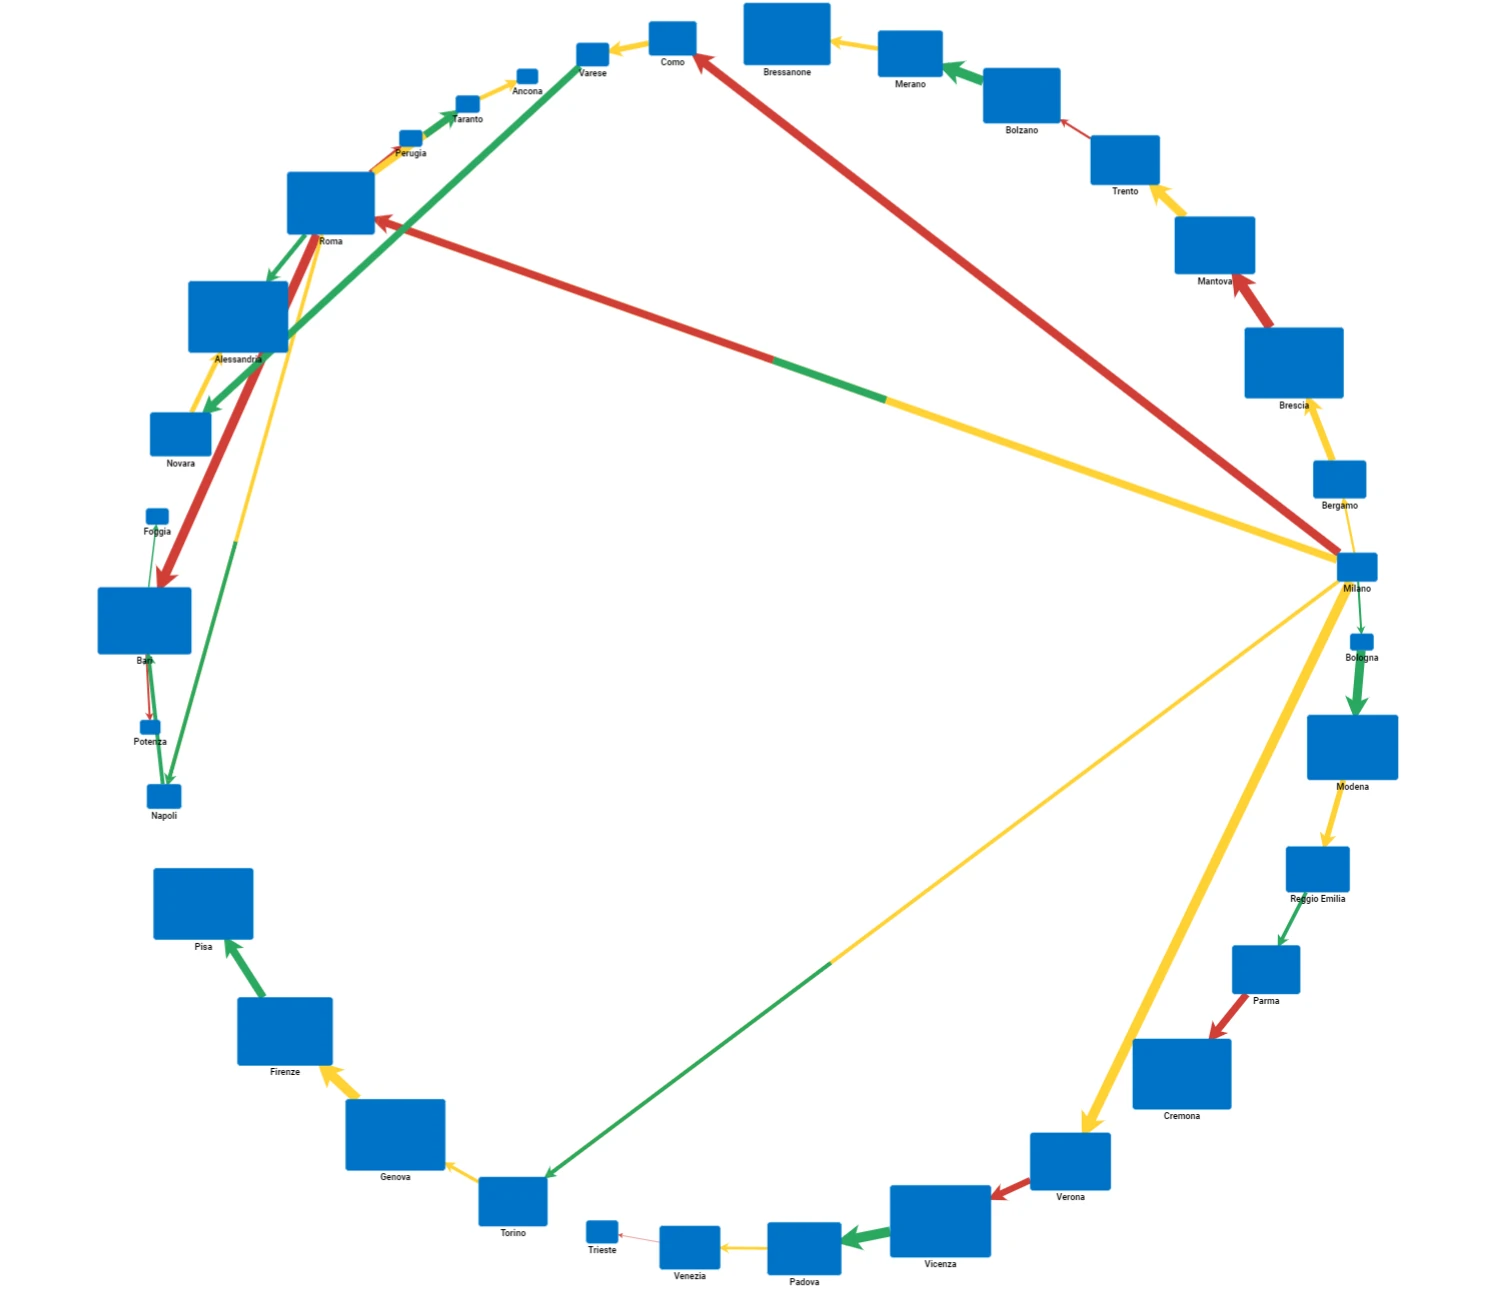
Circular Layout
This layout positions nodes and their corresponding links in a circular arrangement.
Option |
Description |
GOLD Ref |
|---|---|---|
Radius |
It sets the horizontal radius of the elliptical arrangement. |
|
Aspect ratio |
It sets the ratio of the arrangement’s height to its width (1 for a circle, >1 for a vertically elongated ellipse). This is 1 by default. The value must be a positive number. Modifying this value changes the height, but keeps the width and the radius values constant. |
|
Start angle |
It sets the angle (in degrees, clockwise from the positive side of the X axis) of the first element. The default value is 0. |
|
Sweep angle |
It sets the absolute angle (in degrees) between the first and last node. The default value is 360. The value must be greater than zero and less than or equal to 360. If it is not in this range, it will be automatically set to 360. |
|
Node spacing |
It’s the distance between nodes within a layer. |
|
Direction |
It defines how nodes are arranged. Available options are: |
|
Node diameter formula |
It specifies how the diameter of nodes will be calculated. Available options are: |
|
Circular arrangement |
It specifies how nodes should be spaced in the ring. Available options are: |
|
Sorting |
It defines if and how the nodes are sorted. Available options are: |
Node Option Menu
The node options menu allows changing and customizing all the various layout options related to nodes in any Link Analysis chart.
The node options menu can be opened by right-clicking on the corresponding Node layout button in the left input vertical menu.
In the node option menu, there are several tabs available. The options users define in the GENERAL tabs are applied to every single node/link in the selected Link Analysis widget. All the options in the other tabs allow modifying the layout features (e.g. icon, shape, color etc.) of a single node or single link in a Link Analysis widget.
The node options menu contains the same options for each one of the different Link Analysis layout types. Most of the options available in the Node options menu can be customized in parametric mode. Once the node options have been customized as desired, users need to click APPLY to confirm the changes or CANCEL to discard them.
Users can find all the available options and the corresponding GOLD references in the table below.
To know more about GOLD, go to the corresponding page.
Subsection |
Option |
Description |
GOLDref |
|---|---|---|---|
Node customization |
Node size |
It defines the size of nodes. |
|
Node color |
It defines the color of nodes. By clicking it, users can select Standard colors and generated color palettes, otherwise they can use the color picker or insert the color code, which can be: Hex, Rgb, Hsl, Hsv. The default color is blue. |
||
Node shape |
It defines the shape of nodes. From the drop-down menu users can select one of the available shapes, which correspond to those available in the Shapes family in the Graphics category listed here. |
||
Node icon |
It defines the type of icon to be displayed on nodes. By clicking it, users can select the desired one in the corresponding Select icons window. In this window, users can also define the Color and the Color hover of the selected icon. By clicking on the Custom option in the Select icons window, you can upload an icon present on your local machine in SVG or PNG formats. |
||
Icon size (%) |
It defines the size of the icon as a percentage. |
Option |
Description |
GOLDref |
|---|---|---|
Icon attribute |
From this drop-down menu you can select a nominal attribute belonging to the node attribute dataset. By default, the attribute dragged onto the Node layout icon is displayed. Based on the attribute selection, each node displays a different icon for each value of the selected attribute. |
|
Icon size (%) |
It defines the size of the displayed icon. |
|
Hide icon |
If selected, it hides all the icons from nodes in the link chart. |
|
First icon |
In this area, users can decide the default configuration which affects automatic node icon assignation. There is a predefined list of icons, and each distinct value of the node attribute is cyclically assigned an icon. Icons are assigned according to a cyclical sequence, meaning that if the number of distinct values exceeds the number of available icons, the icons repeat in sequence for the remaining values. From this drop-down menu, users can select which icon will start the cycle. |
|
Icon of traces |
In this area, users can decide the single icon configuration for any present node. It displays the list of distinct values of the node attribute and the corresponding icon. By clicking on the icon, users can define a specific icon for the corresponding node value in the Select Icons panel. Users can also define the Color as well as the Color hover of the selected icon (available for standard icons only). Additionally, a Custom option allows users to upload their own icons in PNG or SVG format. |
Option |
Description |
GOLDref |
|---|---|---|
Shape attribute |
From this drop-down menu you can select a nominal attribute belonging to the node attribute dataset. Based on the selected attribute, users can define a rule specifying that each node will display a different shape for each unique value of that attribute. |
|
Hide shape |
If selected, it hides all the shapes from nodes in the link chart. |
|
Size attribute |
Users can define the shape size of a node by selecting either integer of continuous attributes. The shape size of the node will vary according to the corresponding attribute value. |
|
First shape |
In this area, users can decide the default configuration which affects automatic node shape assignation. There is a predefined list of shapes, and each distinct value of the node attribute is cyclically assigned a shape. Shapes are assigned according to a cyclical sequence, meaning that if the number of distinct values exceeds the number of available shapes, the shapes repeat in sequence for the remaining values. From this drop-down menu, users can select which shape will start the cycle. |
|
Shape of traces |
In this area, users can decide the single shape configuration for any present node. It displays the list of distinct values of the node attribute and the corresponding shape. By opening on the shape drop-down menu, users can define a specific shape for the corresponding node value. |
Option |
Description |
GOLDref |
|---|---|---|
Color attribute |
From this drop-down menu you can select a nominal attribute belonging to the node attribute dataset. Based on the selected attribute, users can define a rule specifying that each node will display a different color for each unique value of that attribute. |
|
Color stroke instead of fill |
If selected, only the shape borders of nodes are colored. |
|
First color |
In this area, users can decide the default configuration which affects automatic node coloring. There is a predefined list of colors, and each distinct value of the node attribute is cyclically assigned a color. Colors are assigned according to a cyclical sequence, meaning that if the number of distinct values exceeds the number of available colors, the colors repeat in sequence for the remaining values. |
|
Color of traces |
In this area, users can decide the single color configuration for any present node. It displays the list of distinct values of the node attribute and the corresponding color. By clicking on the color circle, users can define a specific color for the corresponding node value. |
Option |
Description |
GOLDref |
|---|---|---|
Text attribute |
From this drop-down menu you can select any attribute belonging to the node attribute dataset. Based on the selected attribute, users can define the text layout for the name of each unique value of that attribute. |
|
Text Layout |
Here, users can select the text layout of every node value, which can be bold, italic or underlined, as well as the values horizontal alignment, which can be right, center, left, and the vertical alignment, which can be center, top, bottom. |
|
Font family |
Select from the drop-down list the node values’ font. |
|
Font size (px) |
Define the node values font size. |
|
Text Position |
Select from the drop-down list the position of node values displayed text. Possible values are: |
|
Font color |
Click on the color circle to define the font color, which is black by default. In the color selection popup, Standard colors and generated custom color palettes can be used, as well as Rgb, Hex, Hsl and Hsv colors. An Eye dropper is also available to work as a color picker. |
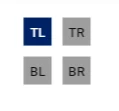
In the HALO tab, users can customize what to display on the four corners of nodes. Configurations can be applied to any of the four corners (TL top-left, TR top-right, BL bottom-left, BR bottom-right). Changes can only be performed for a single corner at a time. To select the corners to be considered in the current modification, you need to use the corners halo selector which is located in the top left corner of the HALO tab.
Once users have selected the node corners on which to perform halo customizations, they need to choose an option from the Halo type drop-down menu. The available options are:
Icon
Number
Depending on which Halo type option has been selected, the lower section of the HALO tab will display completely different options. If Icon is selected, the lower section of the HALO tab will display options that allow users to show an icon on the selected node corner.
Option |
Description |
GOLDref |
|---|---|---|
Icon Attribute |
From this drop-down menu you can select a nominal attribute belonging to the node attribute dataset. Based on the attribute selection, each node displays a different icon for each value of the selected attribute. |
|
First icon |
In this area, users can decide the default configuration which affects automatic node halo icon assignation. There is a predefined list of icons, and each distinct value of the node attribute is cyclically assigned an icon. Icons are assigned according to a cyclical sequence, meaning that if the number of distinct values exceeds the number of available icons, the icons repeat in sequence for the remaining values. From this drop-down menu, users can select which icon will start the cycle. |
|
Halo Position |
In this area, users can decide the default configuration which affects automatic node halo icon position. From this drop-down menu, users can define the halo position of the icon. The available options are: Inside, Outside (default value). |
|
Icon of traces |
In this area, users can decide the single icon configuration for any present node. It displays the list of distinct values of the node attribute and the corresponding icon. By clicking on the icon, users can define a specific icon for the corresponding node value in the Select Icons panel. Users can also define the Color as well as the Color hover of the selected icon (available for standard icons only). Additionally, a Custom option allows users to upload their own icons in PNG or SVG format. |
While, if Number is selected, the lower section of the HALO tab will display options that allow users to show a number on the selected node corner.
Option |
Description |
GOLDref |
|---|---|---|
Number attribute |
From this drop-down menu you can select a continuous or integer attribute belonging to the node attribute dataset. Based on the selected attribute, users can define the text layout for the values of that attribute displayed in the selected node corner. |
|
Text Layout |
Here, users can select the text layout of every halo node value, which can be bold, italic or underlined. |
|
Font family |
Select from the drop-down list the halo values’ font. |
|
Font size (px) |
Define the halo values font size. |
|
Halo Position |
Select from the drop-down list the position of halo node values displayed text. Possible values are: |
|
Font color |
Click on the color circle to define the halo font color, which is black by default. In the color selection popup, Standard colors and generated custom color palettes can be used, as well as Rgb, Hex, Hsl and Hsv colors. An Eye dropper is also available to work as a color picker. |
Option |
Description |
GOLDref |
|---|---|---|
Text Attributes |
Here users can drop extra attributes belonging to the node dataset which will be used in constructing hover text displays. The graphical structure of this area is the standard attribute drop area. |
|
Tooltip Text |
Insert here what you want to display as a tooltip when hovering over each node. You can either: |
|
Tooltip visible |
If selected, the tooltip will be visible on mouse hover. |
Link Option Menu
The link options menu allows changing and customizing all the various layout options related to links in any Link Analysis chart.
The link options menu can be opened by right-clicking on the corresponding Link layout button in the left input vertical menu.
In the link option menu, there are several tabs available. The options users define in the GENERAL tabs are applied to every single node/link in the selected Link Analysis widget. All the options in the other tabs allow modifying the layout features (color, thickness etc.) of a single node or a single link in a Link Analysis widget.
The link options menu contains the same options for each one of the different Link Analysis layout types. Most of the options available in the Link options menu can be customized in parametric mode. Once the link options have been customized as desired, users need to click APPLY to confirm the changes or CANCEL to discard them.
Users can find all the available options and the corresponding GOLD references in the table below.
To know more about GOLD, go to the corresponding page.
Subsection |
Option |
Description |
GOLDref |
|---|---|---|---|
Link customization |
From ArrowHead |
Define from this drop-down menu if and how you want to display the arrow link head defining the starting point of the link. Available options are: |
|
To ArrowHead |
Define from this drop-down menu if and how you want to display the arrow link head defining the destination point of the link. Available options are: |
||
Routing |
Define from this drop-down menu how you want to display the routing of links. Available options are: |
||
Curve |
Define from this drop-down menu how you want to display the curving of links. Available options are: |
||
Link thickness |
Define in this box the thickness of your links. |
||
Link color |
It defines the color of links. By clicking it, users can select Standard colors and generated color palettes, otherwise they can use the color picker or insert the color code, which can be: Hex, Rgb, Hsl, Hsv. The default color is black. |
Option |
Description |
GOLDref |
|---|---|---|
Color attribute |
From this drop-down menu you can select a nominal attribute belonging to the link attribute dataset. Based on the selected attribute, users can define a rule specifying that each link will display a different color for each unique value of that attribute. If the selected color attribute has different values for the same node-link pair, the link line will be divided into sections, each displayed in a different color. |
|
Weight attribute |
From this drop-down menu you can select a continuous or integer weight attribute indicating a weight value for each color node-link pair. The link line is proportionally divided in areas according to the values of the weight attribute. |
|
First color |
In this area, users can decide the default configuration which affects automatic link coloring. There is a predefined list of colors, and each distinct value of the link attribute is cyclically assigned a color. Colors are assigned according to a cyclical sequence, meaning that if the number of distinct values exceeds the number of available colors, the colors repeat in sequence for the remaining values. |
|
Color of traces |
In this area, users can decide the single color configuration for any present link. It displays the list of distinct values of the link attribute and the corresponding color. By clicking on the color circle, users can define a specific color for the corresponding link value. |
Option |
Description |
GOLDref |
|---|---|---|
Thickness attribute |
From this drop-down menu you can select a continuous or integer attribute indicating a thickness value for each node-link pair. The link line is proportionally displayed as thicker or thinner according to the values of the thickness attribute. |
In the HALO tab, users can customize what to display on the above or below the link line. Configurations can be applied above or below any link line (top, bottom). Changes can only be performed for a single line space at the time. To select the above or below line space to be considered in the current modification, you need to use the line halo selector which is located in the top left corner of the HALO tab.
Once users have selected the link line space on which to perform halo customizations, they need to choose an option from the Halo type drop-down menu. The available options are:
Icon
Text
Depending on which Halo type option has been selected, the lower section of the HALO tab will display completely different options. If Icon is selected, the lower section of the HALO tab will display options that allow users to show an icon on the selected node corner.
Option |
Description |
GOLDref |
|---|---|---|
Icon Attribute |
From this drop-down menu you can select a nominal attribute belonging to the link attribute dataset. Based on the attribute selection, each link displays a different icon for each value of the selected attribute. |
|
First icon |
In this area, users can decide the default configuration which affects automatic link halo icon assignation. There is a predefined list of icons, and each distinct value of the node attribute is cyclically assigned an icon. Icons are assigned according to a cyclical sequence, meaning that if the number of distinct values exceeds the number of available icons, the icons repeat in sequence for the remaining values. From this drop-down menu, users can select which icon will start the cycle. |
|
Halo Position |
In this area, users can decide the default configuration which affects automatic link halo icon position. From this drop-down menu, users can define the halo position of the icon. The available options are: Left, Right, Center (default value). |
|
Icon of traces |
In this area, users can decide the single icon configuration for any present link value. It displays the list of distinct values of the attribute selected from the Icon attribute menu and the corresponding icon. By clicking on the icon, users can define a specific icon for the corresponding node value in the Select Icons panel. Users can also define the Color as well as the Color hover of the selected icon (available for standard icons only). Additionally, a Custom option allows users to upload their own icons in PNG or SVG format. |
While, if Text is selected, the lower section of the HALO tab will display options that allow users to show a number or a text on the selected node corner.
Option |
Description |
GOLDref |
|---|---|---|
Text attribute |
From this drop-down menu you can select a continuous, integer or nominal attribute belonging to the link attribute dataset. Based on the selected attribute, users can define the text layout for the values of that attribute displayed in the selected link space area. |
|
Text Layout |
Here, users can select the text layout of every halo link value, which can be bold, italic or underlined, as well as the values horizontal alignment, which can be right, center, left, and the vertical alignment, which can be center, top, bottom. |
|
Font family |
Select from the drop-down list the halo values’ font. |
|
Font size (px) |
Define the halo values font size. |
|
Halo Position |
Select from the drop-down list the position of halo link values displayed text. Possible values are: |
|
Font color |
Click on the color circle to define the halo font color, which is black by default. In the color selection popup, Standard colors and generated custom color palettes can be used, as well as Rgb, Hex, Hsl and Hsv colors. An Eye dropper is also available to work as a color picker. |
Option |
Description |
GOLDref |
|---|---|---|
Text Attributes |
Here users can drop extra attributes belonging to the link dataset which will be used in constructing hover text displays. The graphical structure of this area is the standard attribute drop area. |
|
Tooltip Text |
Insert here what you want to display as a tooltip when hovering over each link. You can either: |
|
Tooltip visible |
If selected, the tooltip will be visible on mouse hover. |