Regression Tree
The Regression Tree task can build a regression model using the decision tree structure.
The Regression Tree task is divided into three tabs:
The Options Tab, where users can choose the attribute they will work on and with.
The Monitor Tab, where users can view the statistics related to the generated rules as a set of histograms.
The Results Tab, where users can visualize the results.
The Options tab
The Options tab has the following structure:
Available attributes, where users will find the dataset’s attributes.
Attributes drop area, where users can drag the chosen attributes.
One Customization pane, where users are able to customize different options.
Available Attributes
Within this section, users will find a list of all the dataset’s attributes. To search for a specific attribute, use the lens icon at the top right of the panel.
Users also have the option of sorting the attributes according to their preferences. They can choose from a drop-down list of the Order by option:
Attribute
Name
Type
Ignored
Role
Attribute Drop Area
The Attribute Drop area is divided into two panes:
The Input attributes, where users can drag and drop the input attributes they want to use to create rules for classifying data. This operation can be done via a Manual List (users need to manually drag & drop the selected attributes onto the pane) or via a filtered list.
The Output attributes, where users can drag and drop here the attributes they want to use to build the network. This operation can be done via a Manual List (users need to manually drag & drop the selected attributes onto the pane) or via a filtered list.
Customization Pane
Within this pane, users can customize the available options.
The options available are:
Minimum number of patterns in a leaf. Users can select the minimum number of patterns that a leaf can contain.
Maximum impurity in a leaf. Users can specify the threshold on the maximum impurity in a node. The impurity is calculated with the method selected in the Impurity measure option. By default, this value is zero, so trees grow until a pure node is obtained (if possible with training set data) and no ambiguities remain.
Pruning method. Users can choose the method used to prune redundant leaves after having created a tree. Available values are:
No pruning
Cost-complexity
Reduced error
Pessimistic
Method for handling missing data. Users can handle missing data by choosing one of the following possible values:
Replace with average: missing values are replaced with the value fixed by the user for the corresponding attribute.
Remove from splits: patterns with missing value in the test attribute are removed from the subsequent nodes.
Include in splits: patterns with missing values in the test attribute at a given node are sent to both the sub-nodes deriving from the split.
Select the attribute to split before the value. If selected, the QUEST method is used to select the best split.
Initialize random generator with seed. If selected, a seed that sets the starting point in the sequence will be used during the randomization process.
Aggregate data before processing. If selected, identical patterns are aggregated and considered as a single pattern during the training phase.
Append results. If selected, the results of this computation are appended to the dataset, otherwise they replace the results of previous computations.
The Monitor tab
Within this tab, users can visualize the properties of the generated rules.
This tab is divided itself into three other tabs:
The Conditions
The Covering
The Error
Conditions
This tab contains a bar plot displaying the following information:
On the X axis: users will see the number of conditions generated.
On the Y axis: users will see the counts of the rules containing specific number of conditions.
Covering
This tab contains a bar plot displaying the following information:
On the X axis: users will see the covering.
On the Y axis: users will see the counts.
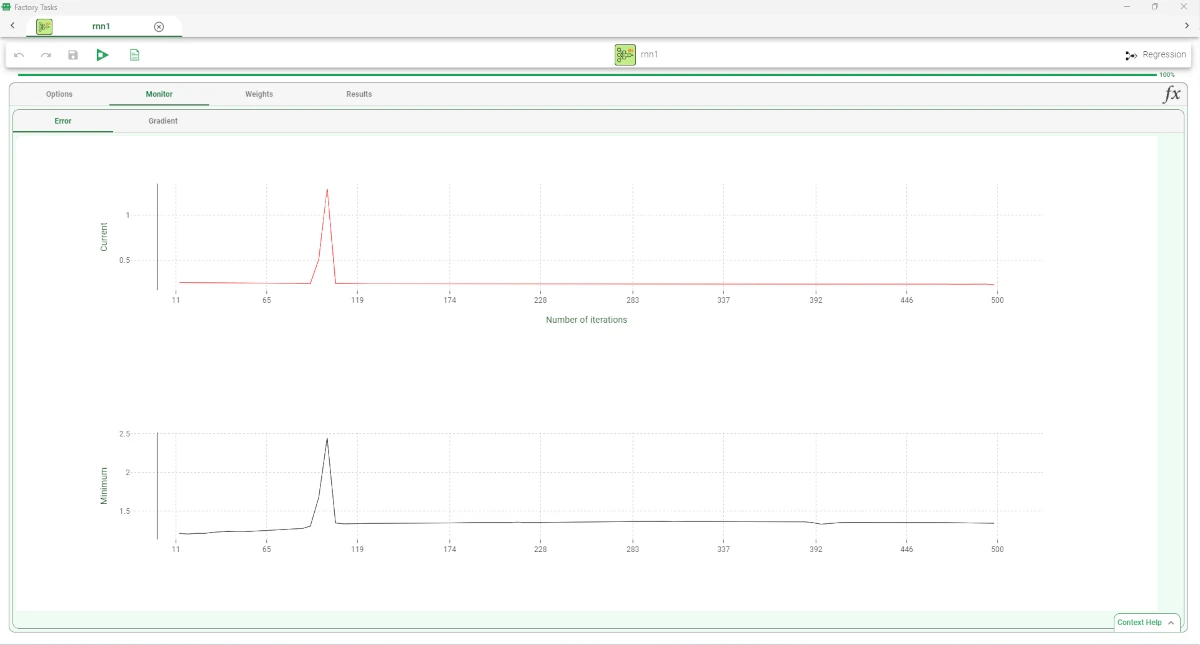
Error
This tab contains a bar plot displaying the following information:
On the X axis: users will see the percentage of error.
On the Y axis: users will see the counts.
The Results tab
Within this tab, users can visualize a summary of the computation.
This tab is divided into two panes:
General Info
Within this pane, users can find the following information:
Task label
Elapsed time (sec)
Result Quantities
Within this pane, users can set and configure the following options:
Average covering for a rule (%)
Average error of a rule
Average number of conditions in a rule
Maximum covering for a rule (%)
Maximum error for a rule
Maximum number of conditions in a rule
Minimum covering for a rule (%)
Minimum error for a rule
Minimum number of conditions in a rule
Number of conditions in a rule
Number of attributes in rules
Number of distinct samples
Number of rules
Number of samples
These checkboxes are checked by default. Users can view values associated with the selected checkbox on the right, by clicking on the drop-down list associated with the checkbox name.
Example
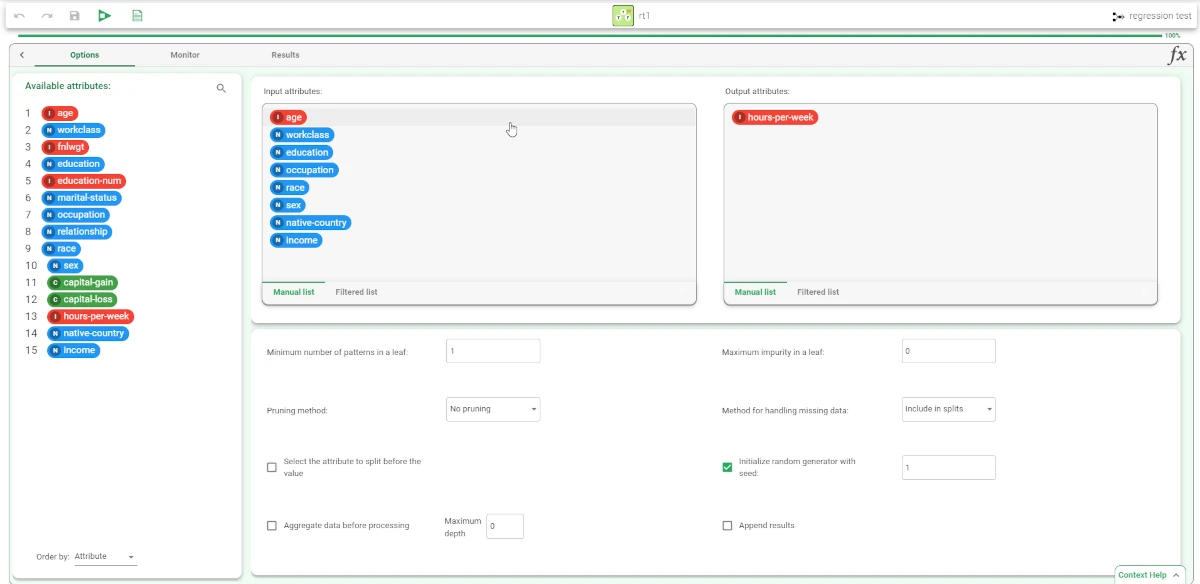
After having imported the dataset via an Import from Text file task and having randomly split the dataset into two subsets (test and training set; 30% test and 70% training) with a Split Data task, add a Regression tree task and link it to the Split Data task. Open the Regression tree task and specify the following parameters:
Output attribute: hours-per-week
Input attributes:
age
workclass
education
occupation
race
sex
native-country
income
Specify No pruning in the Pruning method drop-down list.
Save and compute the task.
The properties of the generated rules can be viewed in the Monitor tab of the Regression tree task. 1588 rules have been generated. To see the distribution for each rule, users can hover over the various colors of the histogram, with the corresponding number of conditions and results. Analogous histograms can be viewed for covering and error, by clicking on the corresponding tabs.
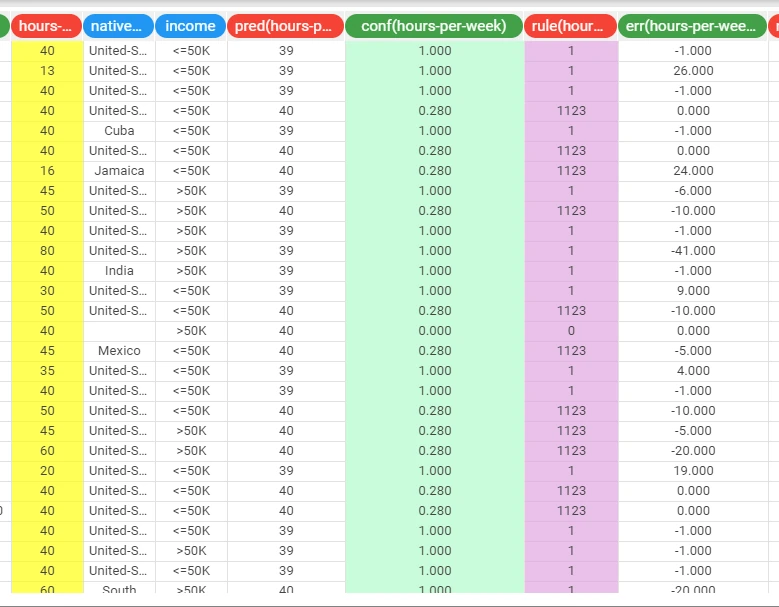
Add an Apply Model task to the Regression Tree task to apply the model to data. The forecast produced can be analyzed by right-clicking the Apply Model task and selecting Take a look. The application of the rules generated by the Regression Tree task has added four columns containing:
the forecast for each pattern: pred(hours-per-week)
the confidence relative to this forecast: conf(hours-per-week)
the most important rule that determined the prediction: rule(hours-per-week)
the classification error, i.e. 1 if misclassified and 0 if correctly classified: err(hours-per-week)