The Rule Manager
The Rule Manager task allows you to inspect, manipulate and optimize a set of rules.
It displays the rules and their conditions in a spreadsheet layout.
It can be used after any task that generates ruleset. Some examples are:
The task is divided into two tabs, the Rules tab and the History tab:
The Rules tab: displays the rules in a spreadsheet-like form. Here you can add new ones, sort or filter them to highlight the most important information.
The History tab: displays all the operations performed during the current session, and allows you to move or delete some of them.
See also
History management is a common feature of all the other Manager tasks. Therefore, the functionality of the History tab is comprehensively explained in the Manager task history overview.
The Rules tab
In the rules tab, rules are visualized and manipulated. The tab is divided in two macro areas:
On the left, the Rule filtering/sorting pane provides a graphical interface for exploring, filtering, and sorting your underlying rules. More information on this pane can be found in a dedicated page.
- On the right, three spreadsheets display from the top to the bottom:
Rule conditions
Rule coverings
Rule errors.
At the bottom of the three tables, the rule Info bar displays the total number of rules present and currently displayed, along with the maximum number of available conditions.
Tip
The three spreadsheets located at the right of the tab synchronize seamlessly. Whenever you select a column header, index row, or single cell in any of the three tables, the other two will automatically scroll and center themselves in the same position, highlighting their corresponding interconnected information.
Condition spreadsheet
In the top spreadsheet you find an overall visualization of your ruleset:
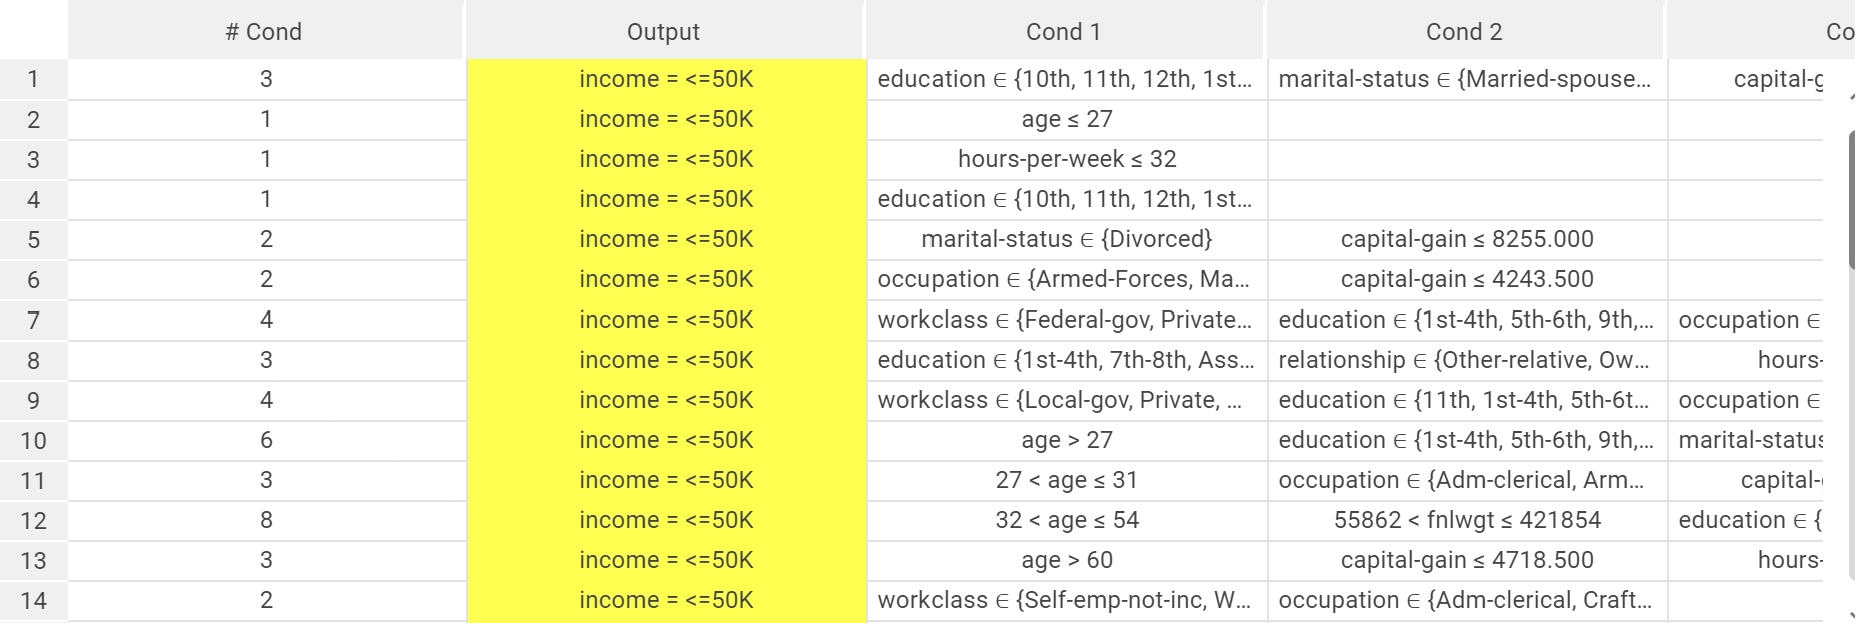
- Each row represents a single rule of your ruleset. We have respectively:
On the first column, it is displayed the number of conditions (#Cond) the rule is composed by.
On the second column, it is displayed the Output of the considered rule in the format
<output name> = <output value>.Starting from the third column, the various conditions are presented one per column.
The Output column has a yellow background; it is ordered first by Output name and then by Output value.
The number of columns of the whole spreadsheet is <maximum number of conditions>+2. If a single rule has fewer conditions than the maximum, the rest of the columns is left missing.
By right-clicking on the header row you can open the following context menu:
Sort ascending: it sorts the ruleset according to the selected columns in ascending order. The other spreadsheets are ordered correspondingly. The Rule filtering/sorting pane is filled with the sort metadata considered.
Sort descending: it sorts the ruleset according to the selected columns in descending order. The other spreadsheets are ordered correspondingly. The Rule filtering/sorting pane is filled with the sort metadata considered.
No sort: it removes any existing ordering on the selected columns, if present. This ordering is erased also by the other spreadsheets. The Rule filtering/sorting pane is modified accordingly.
Clear all sorts: it restores the ordering to the original one for all the spreadsheets. It also clears completely the Sort pane of the Rule filtering/sorting pane.
By right-clicking on the index column or on any of the first two columns of the table, you can open the following context menu:
Create rule: it adds a new rule to the end of the ruleset, and the focus of the three table is shifted to the end of each spreadsheet.
Delete selected rules: it deletes all the selected rules from the ruleset.
Change rule output: it allows the user to modify the Output name or the Output value through a dedicated wizard for the selected rules. In the first step of the wizard you can select the Output attribute among the present Outputs; while in the second you can select one of the values available for the selected Output.
Append condition: it adds a new condition for the selected rules at the end of each row. You can configure the new condition in the condition wizard. A detailed description of this dialog box is provided in next section.
Delete selected conditions: it deletes all the selected conditions from the ruleset.
Copy selected conditions: it copies into the clipboard the code and the logical relation among the selected conditions.
Go to row: it scrolls and focus the three tables on the selected rule.
Tip
Copying into the clipboard condition codes and relations can be valuable for what-if scenarios in a Data Manager task. In Query panel you can use the Paste conditions tool to filter the dataset based on specific ruleset conditions. This facilitates the analysis of the impact of particular rules on your dataset.
By right-clicking on any of the condition cell you will open a context menu with all the precedent entries of the index column case and with:
Edit condition: it allows you to change the considered condition into a new one. You can configure the new condition in the condition wizard. A detailed description of this dialog box is provided in the next section.
Hint
By directly editing the table, you can access to the following operation shortcuts (to start editing simply double-click on the considered cell):
By double-clicking on a cell of the Output column, you will trigger a Change rule output operation for the considered rule.
By double-clicking on a missing condition cell, you will trigger an Append condition operation for the considered rule.
By double-clicking on a filled condition cell, you will trigger an Edit condition operation for the selected condition of the considered rule.
Covering spreadsheet
In the middle spreadsheet, the Rule covering is displayed:
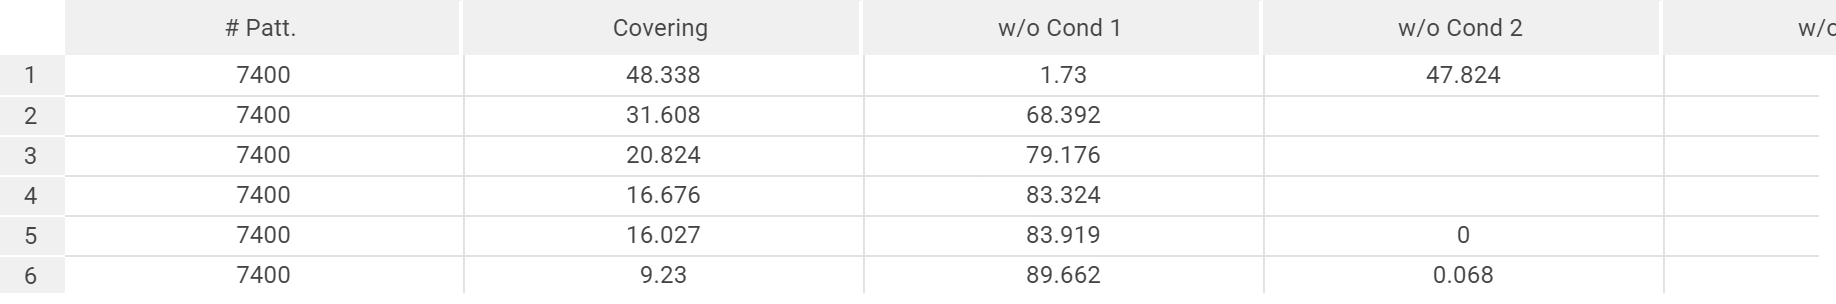
- Each row represents a single rule of your ruleset. We have respectively:
On the first column it is displayed the number of lines (#Patt) belonging to the Output class of the considered rule.
On the second column it is displayed the total Covering of the entire rule.
Starting from the third column, you can see the covering obtained by the entire rule when the considered condition is not included. This allows you to immediately evaluate the impact that each condition has on the entire rule.
By right-clicking on the header row you can open the following context menu:
Sort ascending: it sorts the ruleset according to the selected columns in ascending order. The other spreadsheets are ordered correspondingly. The Rule filtering/sorting pane is filled with the sort metadata considered.
Sort descending: it sorts the ruleset according to the selected columns in descending order. The other spreadsheets are ordered correspondingly. The Rule filtering/sorting pane is filled with the sort metadata considered.
No sort: it removes any existing ordering on the selected columns, if present. This ordering is also erased by the other spreadsheets. The Rule filtering/sorting pane is modified accordingly.
Clear all sorts: it restores the ordering to the original one for all the spreadsheets. It also clears completely the Sort pane of the Rule filtering/sorting pane.
You can start editing the total Covering column to change and fix a specific covering statistic for the rule.
Attention
Since the Covering value is a percentage, please enter your new statistic value as a number between 0 and 100.
Error spreadsheet
In the bottom spreadsheet, visualization of Rule error is displayed:
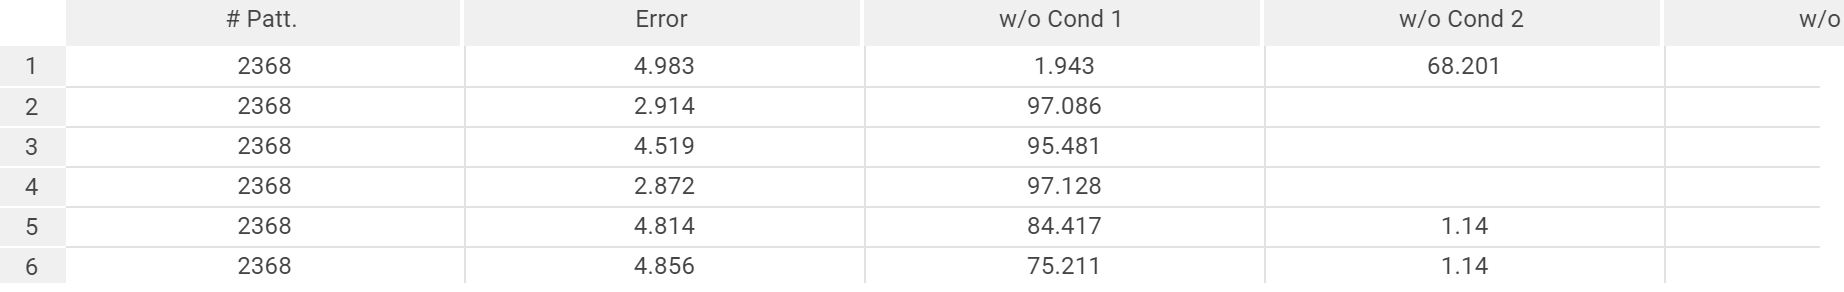
- Each row represents a single rule of your ruleset. We have respectively:
On the first column it is displayed the number of lines (#Patt) not belonging to the Output class of the considered rule.
On the second column it is displayed the total Error of the entire rule.
Starting from the third column, you can see the error obtained by the entire rule when the considered condition is not included. This allows you to immediately evaluate the impact that each condition has on the entire rule.
By right-clicking on the header row you can open the following context menu:
Sort ascending: it sorts the ruleset according to the selected columns in ascending order. The other spreadsheets are ordered correspondingly. The Rule filtering/sorting pane is filled with the sort metadata considered.
Sort descending: it sorts the ruleset according to the selected columns in descending order. The other spreadsheets are ordered correspondingly. The Rule filtering/sorting pane is filled with the sort metadata considered.
No sort: it removes any existing ordering on the selected columns, if present. This ordering is also erased by the other spreadsheets. The Rule filtering/sorting pane is modified accordingly.
Clear all sorts: it restores the ordering to the original one for all the spreadsheets. It also clears completely the Sort pane of the Rule filtering/sorting pane.
You can start editing the total Error column to change and fix a specific error statistic for the rule.
Attention
Since Error value is a percentage, please enter your new statistic value as a number between 0 and 100.
Configuring a new condition
Whenever you wish to append a new condition or edit an existing one, the condition wizard guides you in the definition of the properties of the new constraint.
The wizard is composed by two steps. You can navigate through the different wizard steps by selecting the Back and Next buttons located in the bottom right corner of this panel. In the case of the Edit condition operation, the wizard opens directly on the second step, but you can still navigate to the first step by using the buttons.
In the first step, you need to select the attribute considered in the condition. You can choose from all the attributes available in the underlying data.
Tip
The list of available attributes is always displayed in the Rules attributes pane.
The second step is used to define the new condition. The panel presented is equivalent to the condition panels used in the Query panel, which serve to apply filters on the underlying data. For a comprehensive understanding of these panels, refer to the Data Manager documentation pages:
To add a new condition, follow these step-by-step instructions:
Procedure
Right-click on the blank header on top of the index column and select Create rule.
Select one of the outputs displayed in the rule creation wizard, and then one of its available values.
Click SAVE.
Double-click on one of the missing cells in the condition columns of the newly created rule or right-click on the new rule row and select the Append condition entry.
Select one of the available attributes in the condition creation wizard. This will be the attribute on which you will base your condition.
Configure your condition according to the description provided at this section, and then click SAVE.