Funnel Charts
Funnel charts are commonly used to display business data across different stages or categories. They are valuable for identifying patterns, performance variations, and potential inefficiencies at each stage of a process.
In Rulex Platform three different types of funnel charts are available:
Funnel charts can be oriented horizontally and vertically, whereas the Funnel Area chart is always vertically oriented.
Horizontal Funnel chart
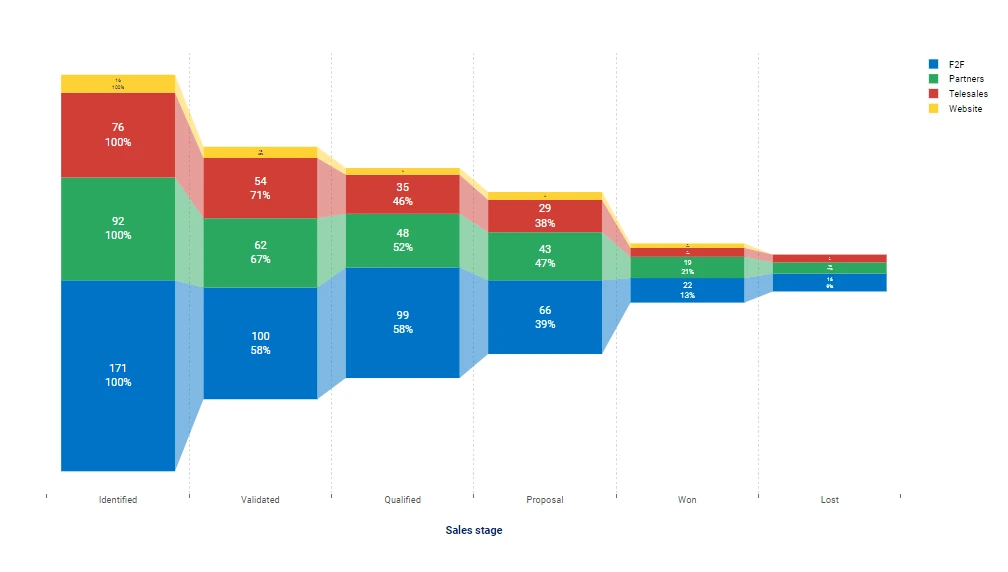
This type of funnel (Hfunnel chart on Factory’s interface) is aligned horizontally, with its widest section on the left side, narrowing as it moves to the right. This layout is suited for visualizing step-by-step processes moving through a linear path.

Dimension (mandatory fields are in bold) |
Type |
Description |
|---|---|---|
X |
axis/grid |
It controls the attribute to be visualized on the x-axis. |
Y |
output |
It controls the output, displaying the count and the percentage of entities. |
Color |
target |
It controls the subcategories of the chart. |
Vertical Funnel chart
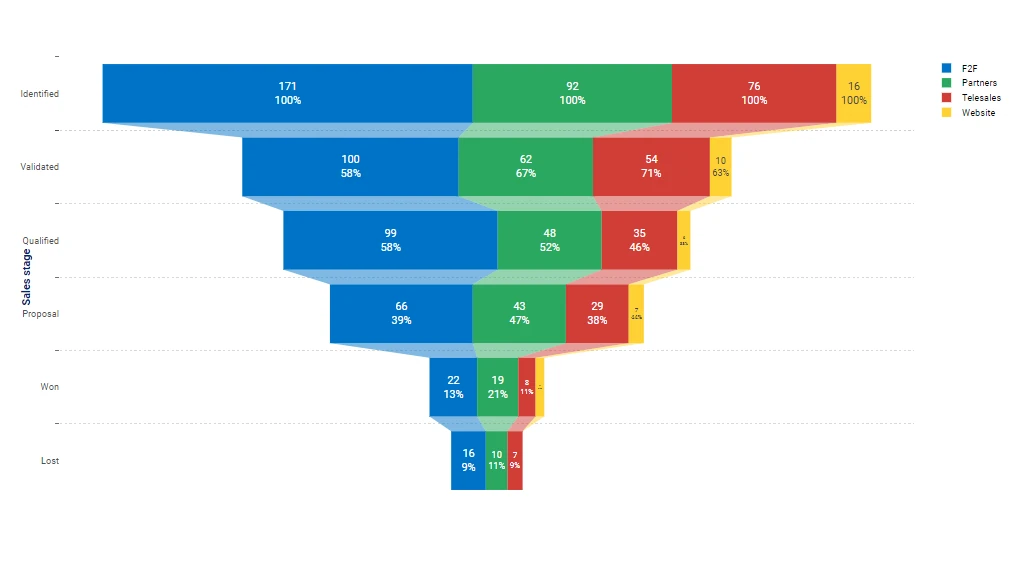
The Vertical Funnel chart (VFunnel chart on Factory’s interface) is aligned vertically, with its widest part at the top, narrowing down as it progresses towards the bottom. This layout is more intuitive when representing downward processes, reflecting a reduction in the number of entities.

Dimension (mandatory fields are in bold) |
Type |
Description |
|---|---|---|
X |
output |
It controls the output, displaying the count and the percentage of entities. |
Y |
axis/grid |
It controls the attribute to be visualized on the y-axis. |
Color |
target |
It controls the subcategories of the chart. |
Funnel Area chart
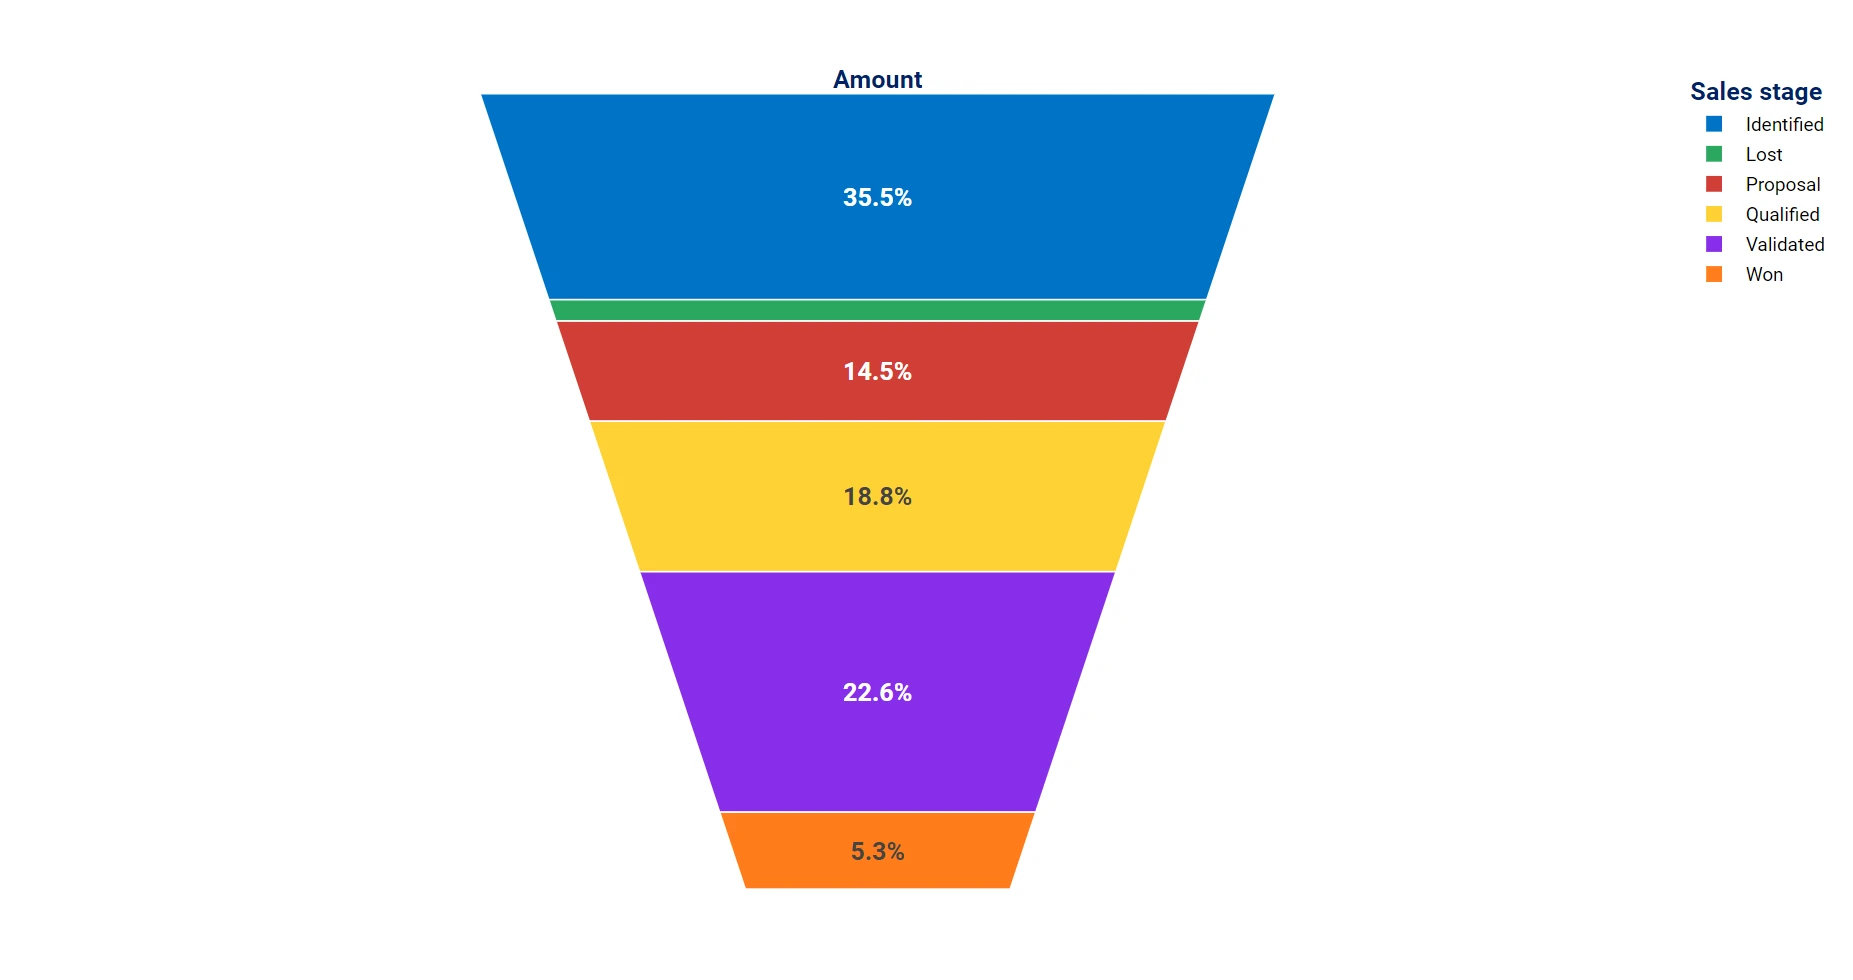
The Funnel Area chart is a type of funnel chart where the sections are displayed as stacked trapezoids instead of rectangles. The height of each section reflects the data size and indicates the percentage of the total volume at each stage of the process.

Dimension (mandatory fields are in bold) |
Type |
Description |
|---|---|---|
Y |
output |
Attributes on this dimension are used as weight operator. |
Color |
axis/grid |
It controls the labels and the sectors’ division of the funnel area. |
Note
Note that if you drag and drop two attributes onto the Color Target of a Funnel area chart, the chart will automatically change to a Sunburst chart.