Dimension option menus
Some plot configurations, even if they are not directly connected to plot input definition, require a plot re-evaluation since they affect the points’ reconstruction. All these configurations are available into the Dimension option menus. These menus can be opened by right-clicking on the corresponding dimension button in the left input vertical menu.
Each one of the different dimension buttons opens a different dimension menu. Therefore, we are going to describe them one by one in the next sections.
Note
If more than one subplot are present, options can be changed only for a single subplot or for a sub-list of the considered subplots. To select the list of subplots users want to consider in the current option modification, they can use the Subplot selector which appears on the top of the Dimension option menu if more than one subplot are present.
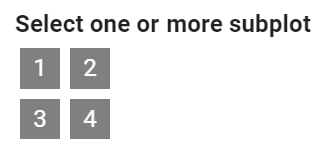
Subplots are listed according to their position starting from left to right, from top to bottom. If you click on the corresponding square icon on the Subplot selector you are going to add this subplot to the sub-list considered in the current option modification. The icon will become checked to highlight the selection performed.
Plot option menu
The Plot options menu controls the set of options which affect the plot as a whole. They slightly differ according to the selected plot type. Here we are going to explain only the general one while you can refer to the single plot pages for the specific ones.
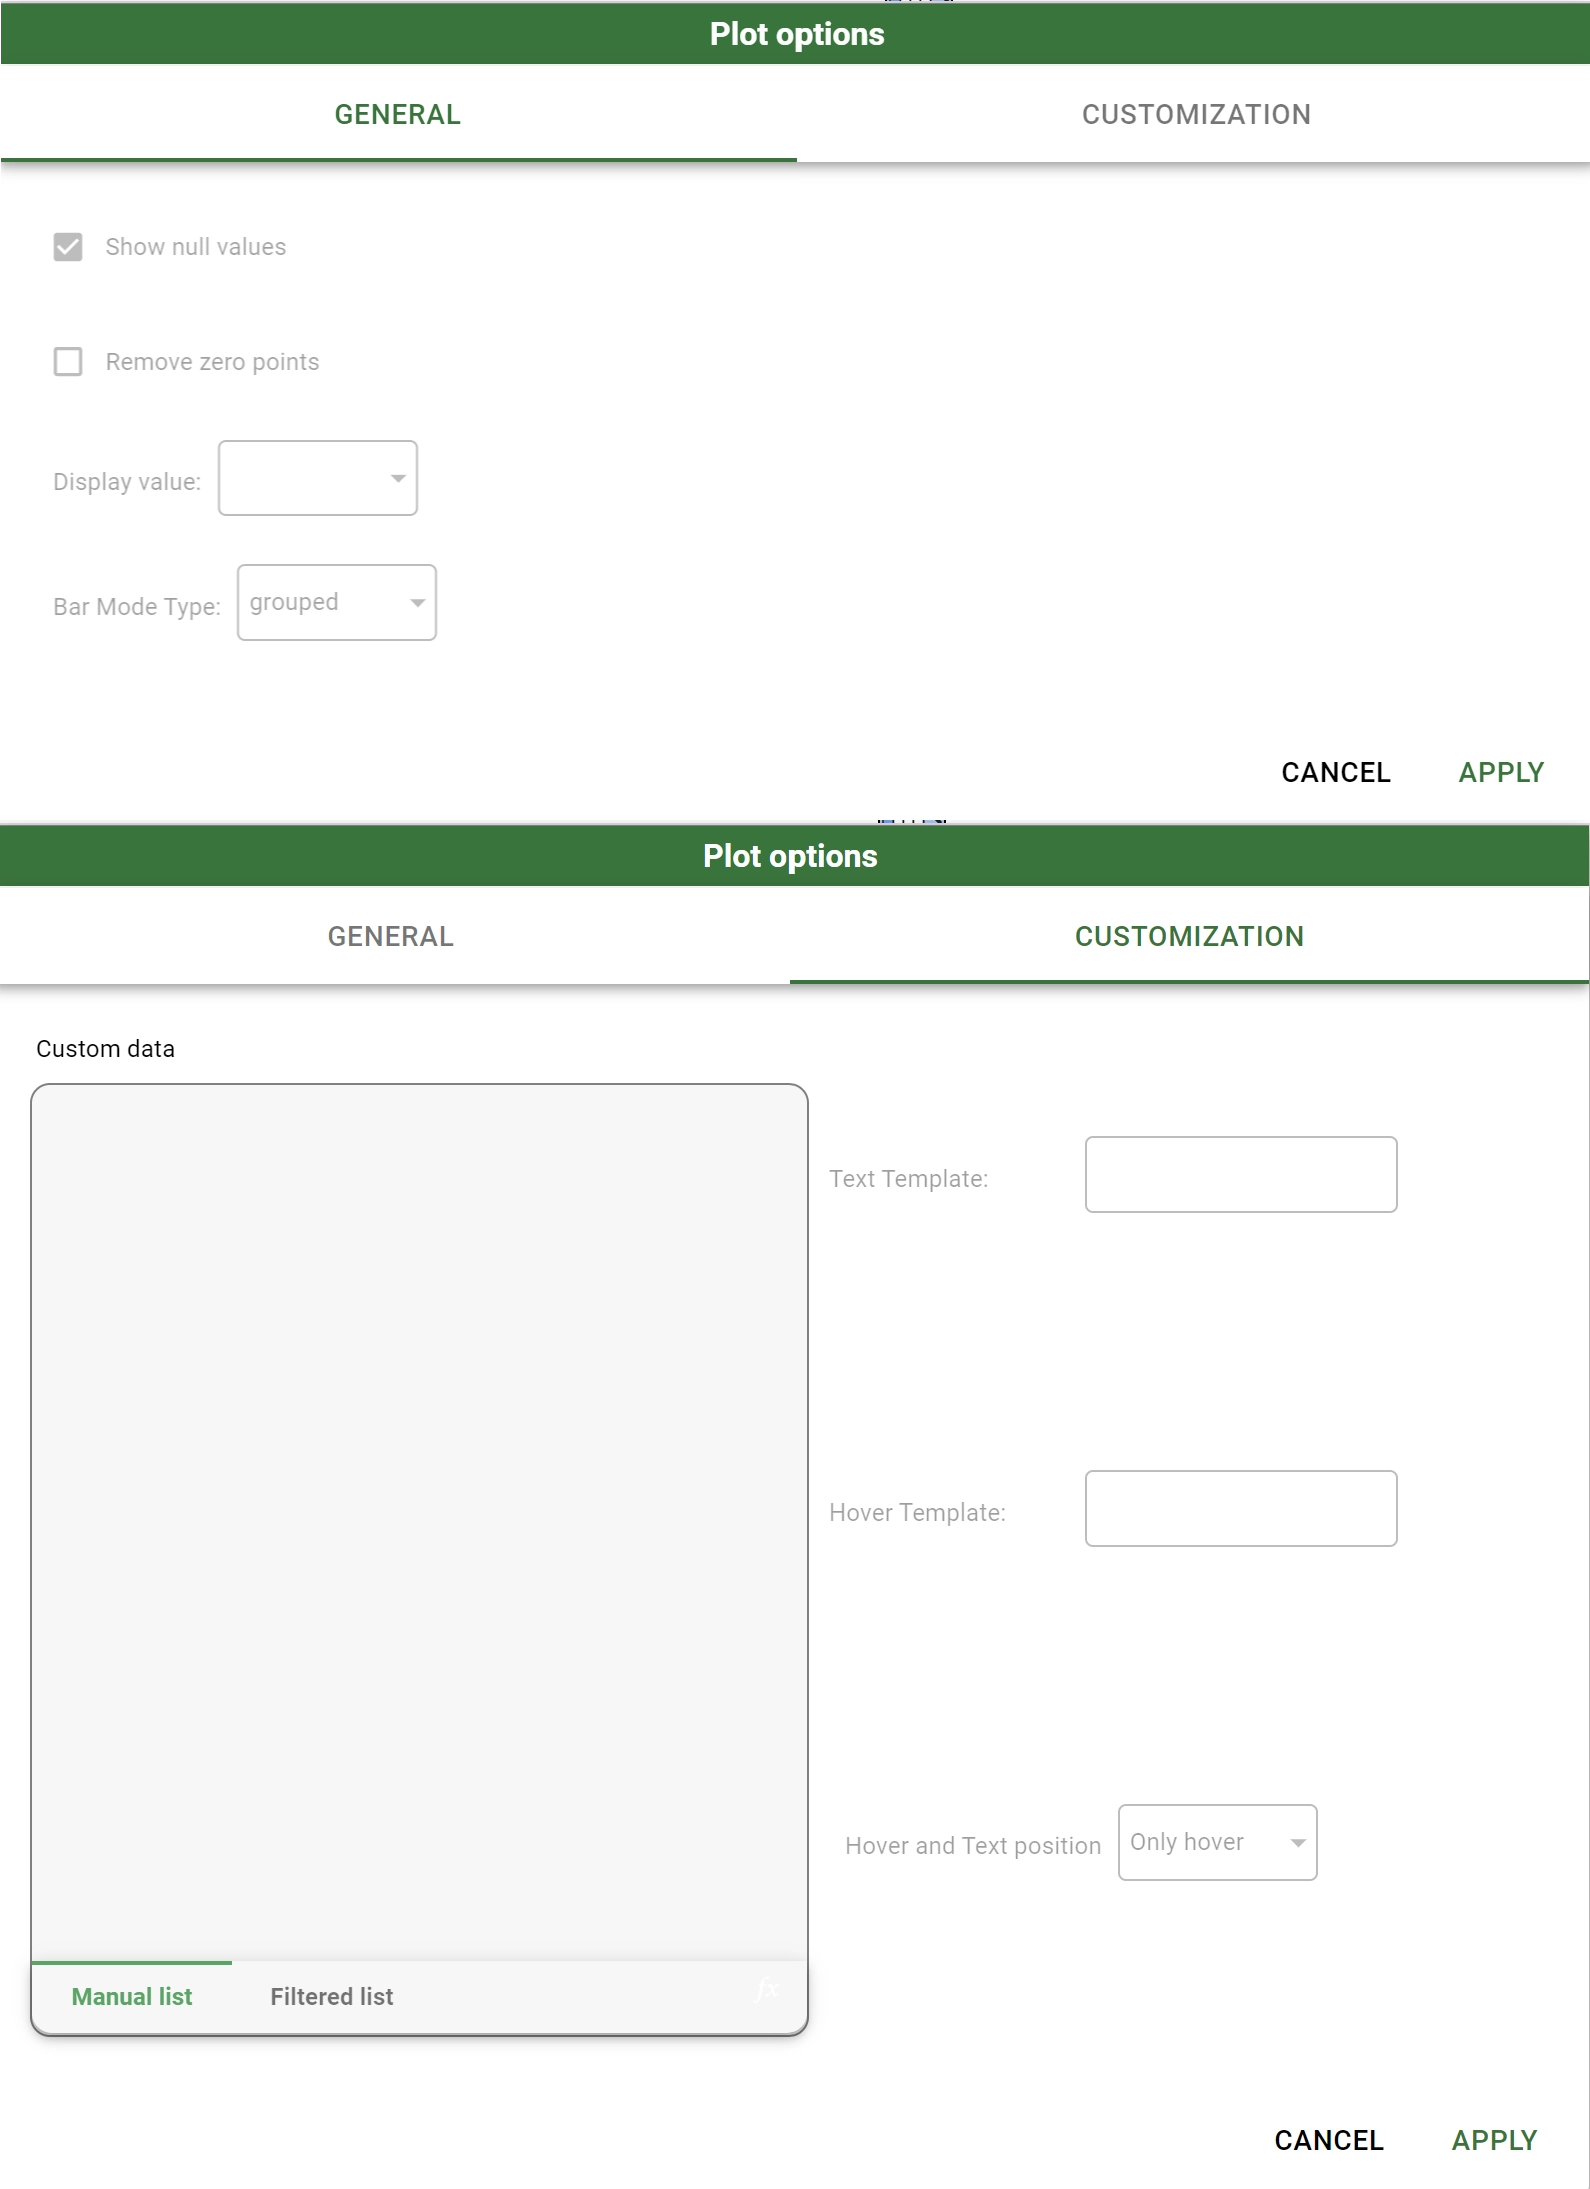
The Plot options menu is divided into two tabs:
General
Customization
In the General tab, general configurations are listed. In particular:
Show null values: it controls if the None missing value should be drawn on the plot. If checked, an extra category called None is added to the prior list.
Remove zero points: if checked, all the bars or points with no occurrences are erased from the plot.
Display value: it decides if the plot should be drawn with: * standard: absolute standard value. * percentage on tot: percentage obtained by dividing the absolute standard value with respect to the sum of all the values for all the targets (color, style…). * percentage on trace: percentage obtained by dividing the absolute standard value with respect to the sum of all the values at fixed targets (color, style…).
In the Customization tab, users can define the customization for point/bar text annotations, point/bar hover text as well as position of this information with respect to the linked point/bar:
Custom data: here users can drop extra attributes which will become available to be used in constructing text annotations or in hover text display. The position on the list is going to be crucial in the template definition. The graphical structure of this component is equal to a standard attribute drop area.
Text template: the template used to construct text information associated to any point/bar. Users can refer to a particular input attribute by using
%followed by its name into curly brackets as%{x}or%{y}. If they want to refer to a Custom data defined in the previous option you should use the following format%{customdata[<index of the list 0-based>]}.- Hover template: the template used to construct the text information associated to any point/bar shown at the mouse hover. Users can refer to a particular input attribute by using
%followed by its name into curly brackets as%{x}or%{y}. If they want to refer to a custom data defined in the previous option, users should use the following format%{customdata[<index of the list 0-based>]}. Important
Custom data list should be referenced in the Text template or in the Hover template by using a 0-based index. This means that the top entry of the list is referenced in the Text template for example as
%{customdata[0]}Note
Users can also specify the format for any input attribute or custom data used in the Text template or in the Hover template. To specify a format, use the following format
%{<variable>:<format>}. Format expression should be written as described into the format tick labels note.
- Hover template: the template used to construct the text information associated to any point/bar shown at the mouse hover. Users can refer to a particular input attribute by using
Hover and text position: it controls the visibility of the text information and its relative position to respect of the associated point/bar.
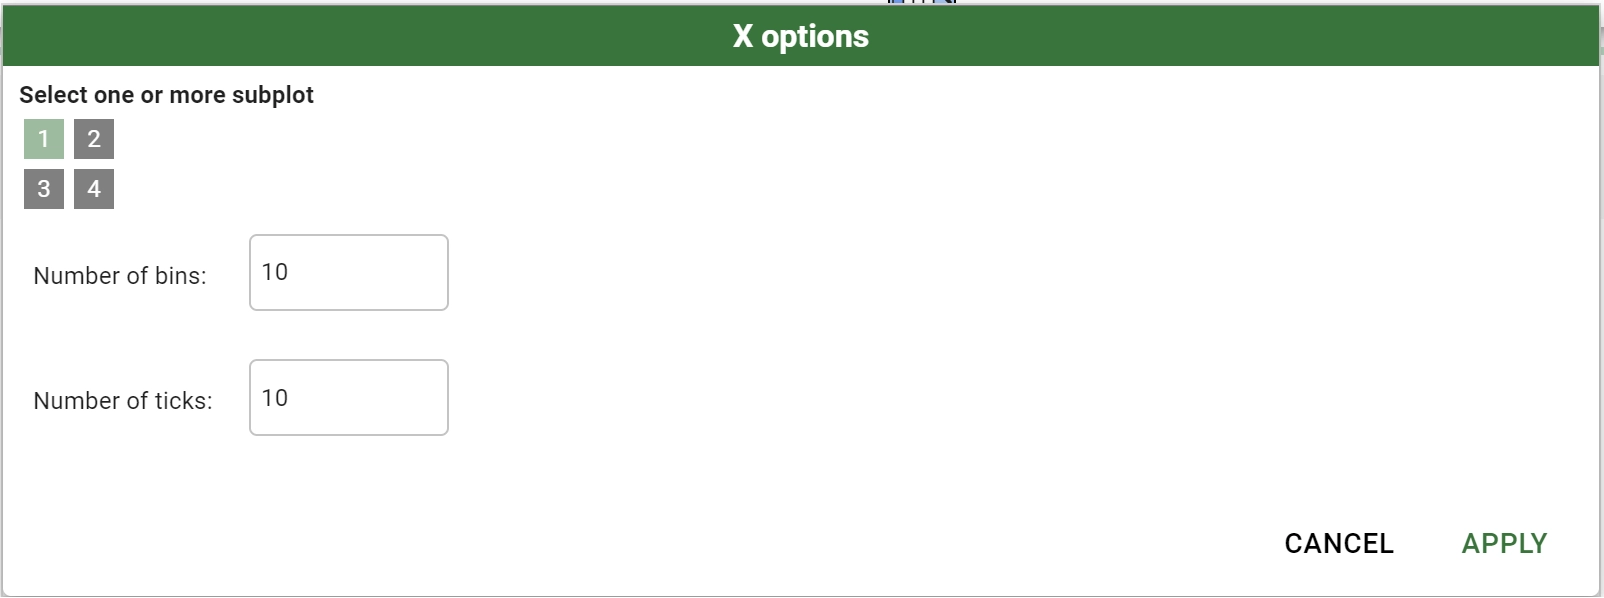
X options
X options allow users to define how values are grouped together along the x-axis. They include:
Number of bins: the number of bins displayed on the x-axis. Bins divide the attribute values into even intervals. This option only affects ordered input attributes.
Number of ticks: the number of ticks displayed on the x-axis. Ticks display specific values on the x-axis. This option only affects ordered input attributes.
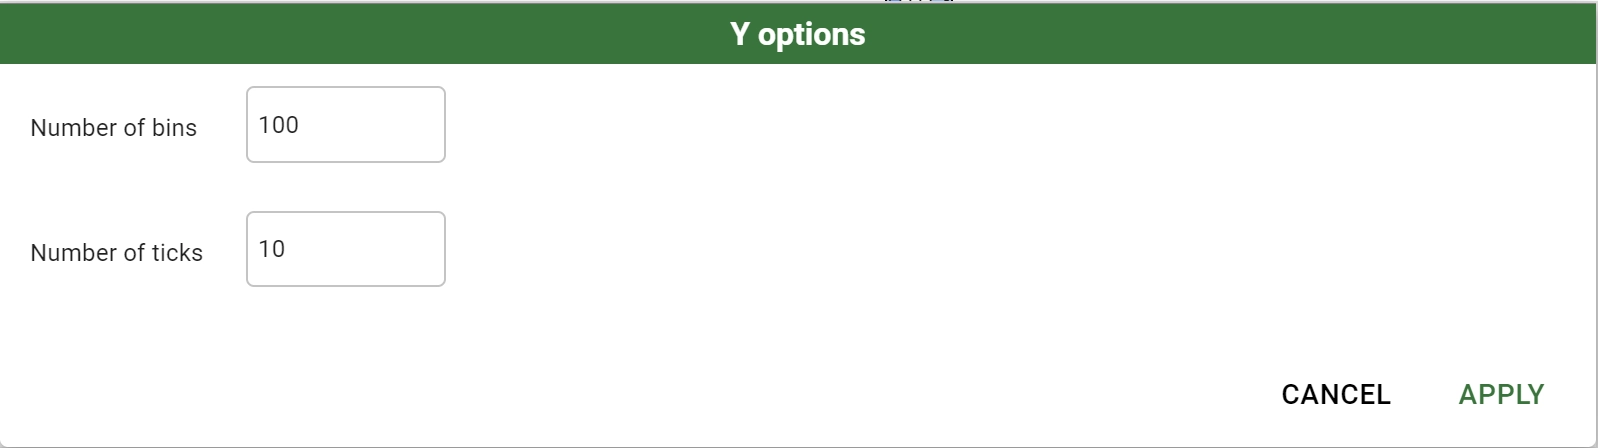
Y options
Y options allow users to define how values are grouped together along the y-axis. They include:
Number of bins: the number of bins displayed on the y-axis. Bins divide the attribute values into even intervals. This option only affects ordered input attributes.
Number of ticks: the number of ticks displayed on the y-axis. Ticks display specific values on the y-axis. This option only affects ordered input attributes.
Color options
Color options allow users to define how values are grouped together along the color-axis. They include:
Number of bins: the number of bins displayed on the color-axis. Bins divide the attribute values into even intervals. This option only affects ordered input attributes.
Number of ticks: the number of ticks displayed on the color-axis. Ticks display specific values on the color-axis. This option only affects ordered input attributes.
Below these options, the panel is divided into two areas:
On the left, users can decide the default configuration which affects automatic trace coloring.
On the right, users can decide the single configuration for any present trace.
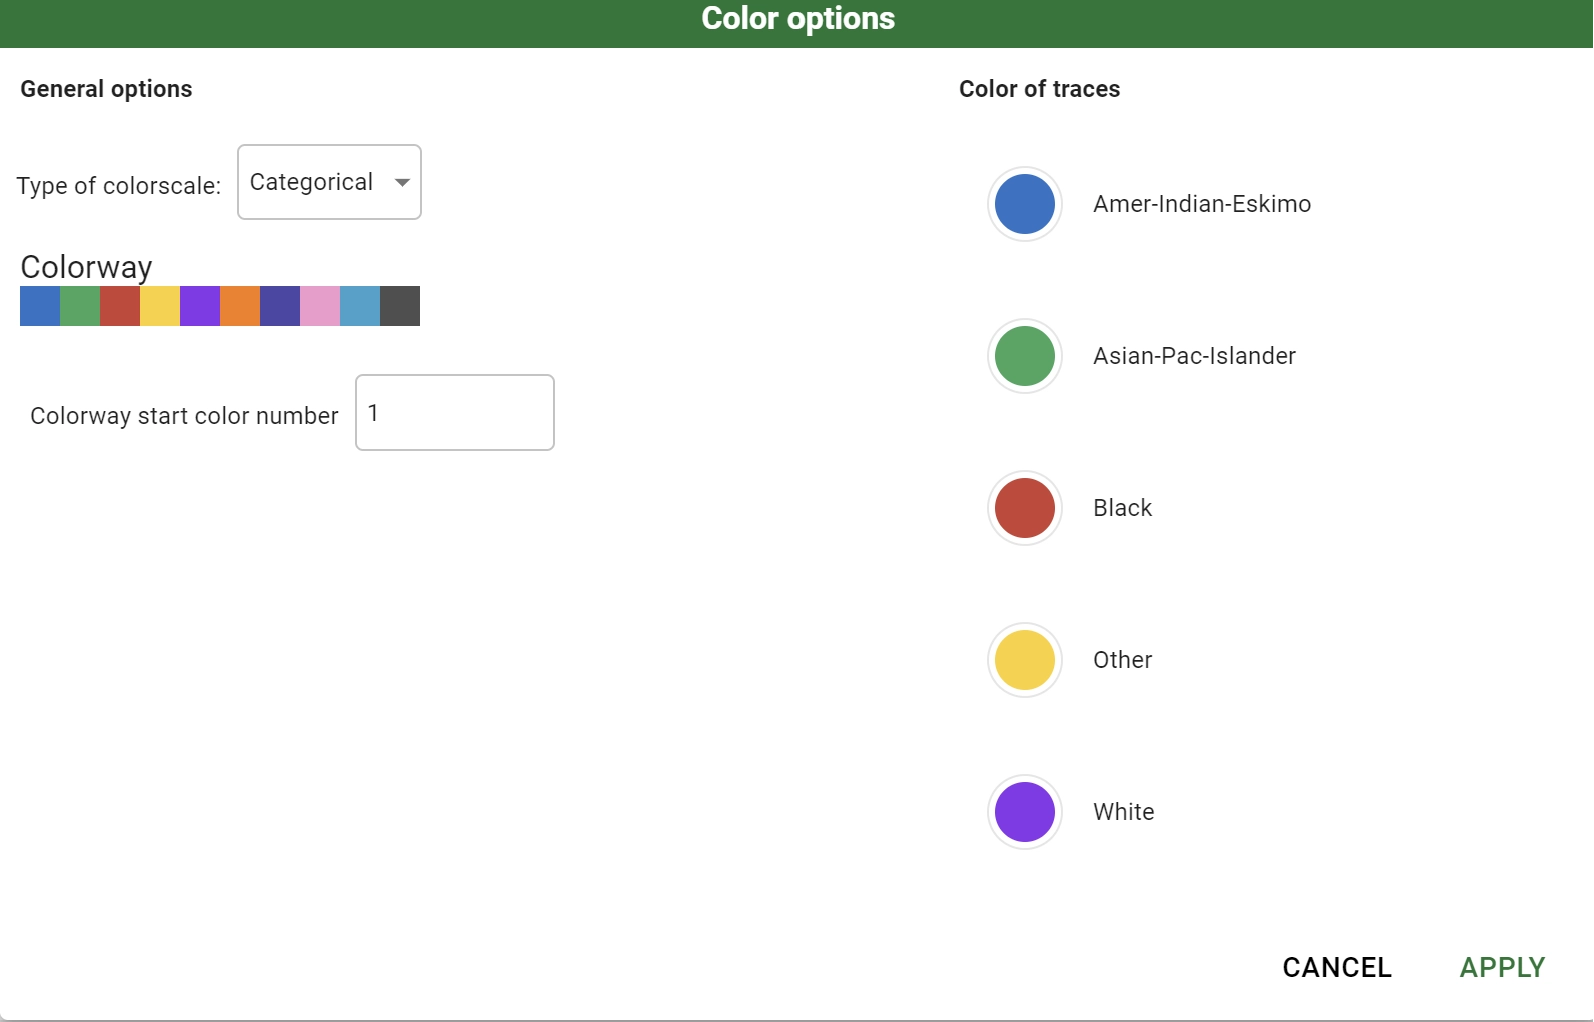
In the default configuration part on the left users first need to select if they are changing:
the Categorical colorway (affecting plots where color input attributes are nominal or binary).
the Sequential colorscale (affecting plots where color input attributes are ordered).
Then, below these options, users are able to change the default colorway or colorscale among a list of possibilities. Available color scales and colorways are presented in the image below.
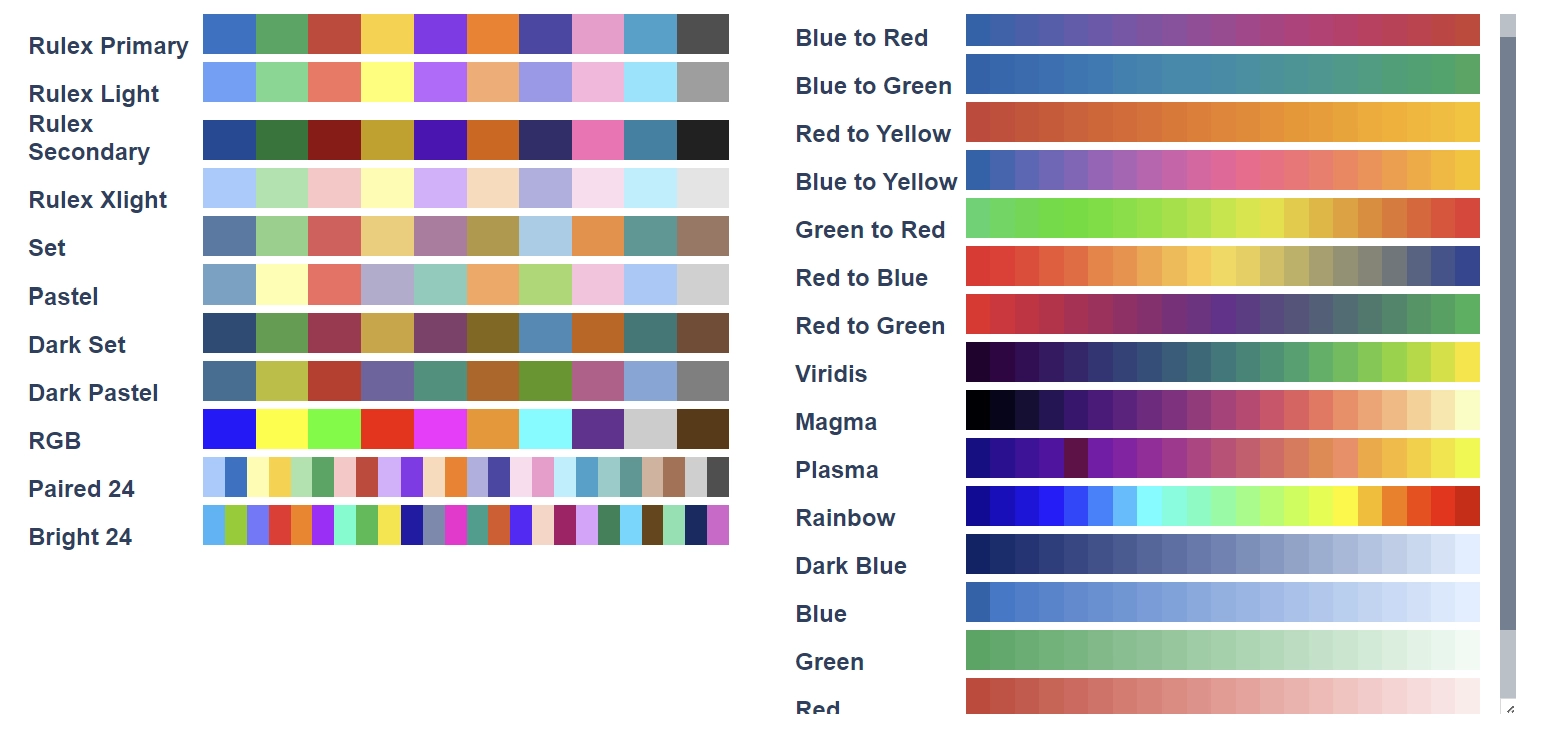
Categorical and sequential color scales
If a Categorical colorway has been chosen, the starting color can be fundamental to obtain the desired pattern. This starting position can be varied by acting on the Colorway start color number field.
On the right side, instead, a list of all the available traces with the corresponding associated color is drawn. Users can change any of the proposed color and fix a color for a certain trace by simply operating on the corresponding color picker. The list of the operations and interactions a user can perform with a Rulex Platform color picker are listed in the option controller general overview.
Style options
Style options allow you to define style property for your marker or lines. The presence of both the controlled options (line and markers) depends on the type of plot and on the general Plot options in some plot type. Options present in this panel include:
Number of bins: the number of bins used to discretize an ordered attribute dropped on the style dimension. Bins divide the attribute values into even intervals. This option only affects ordered input attributes.
Below this option, the panel is divided into two areas:
On the left, users can decide the default configuration which affects automatic trace styling.
On the right, users can decide the single configuration for any present trace.
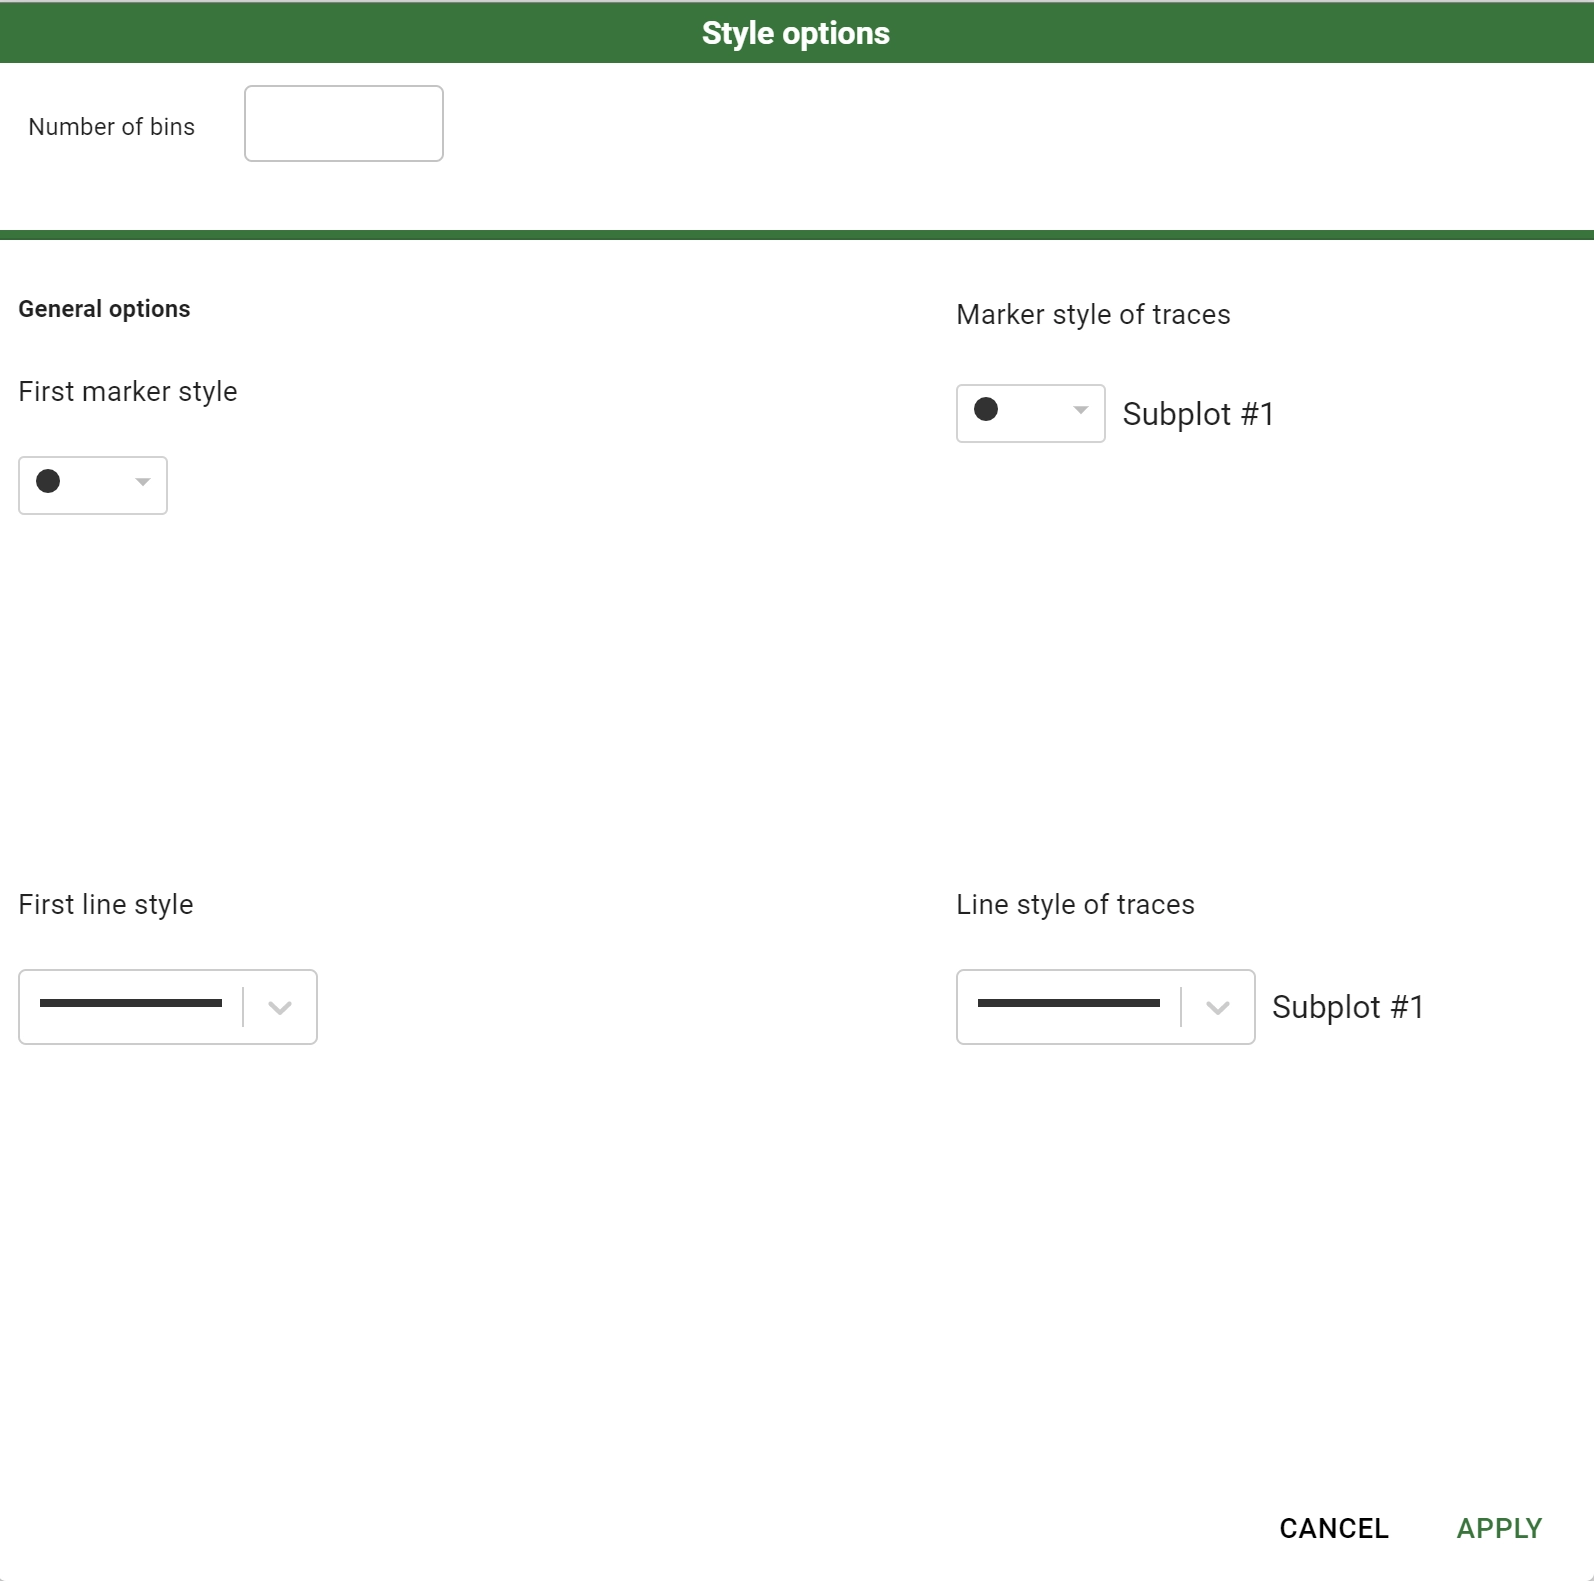
In the default configuration part on the left users can change:
first line style: the type of dashing users want to be used as the default one.
first marker style: the type of marker users want to be used as the default one.
Available dashing for lines and point type for marker are explained in summary below.
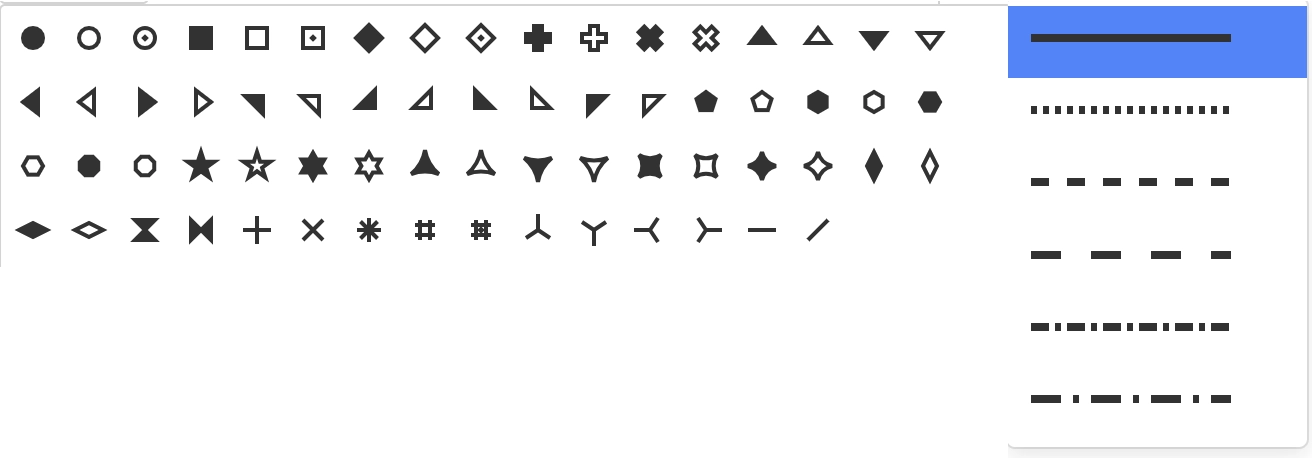
Marker types and line dashing
On the right side instead, a list of all the available traces with the corresponding associated style is drawn. Users can change any of the proposed dash and fix a style for a certain trace line by simply operating on the corresponding line dashing selector. Users can also change, where provided, the marker type used in their plot for a certain list of trace points by simply operating on the corresponding marker type selector.
Size options
Size options allow users to define the size or the width for your marker or lines. The presence of both the controlled options (line and markers) depends on the plot type and on the general Plot options in some plot types. Options present in this panel include:
Number of bins: the number of bins used to discretize an eventual ordered attribute dropped on the size dimension. Bins divide the attribute values into even intervals. This option only affects ordered input attributes.
Below this option, the panel is divided into two areas:
On the left, users can decide the default configuration which affects automatic trace styling.
On the right, users can decide the single configuration for any present trace.
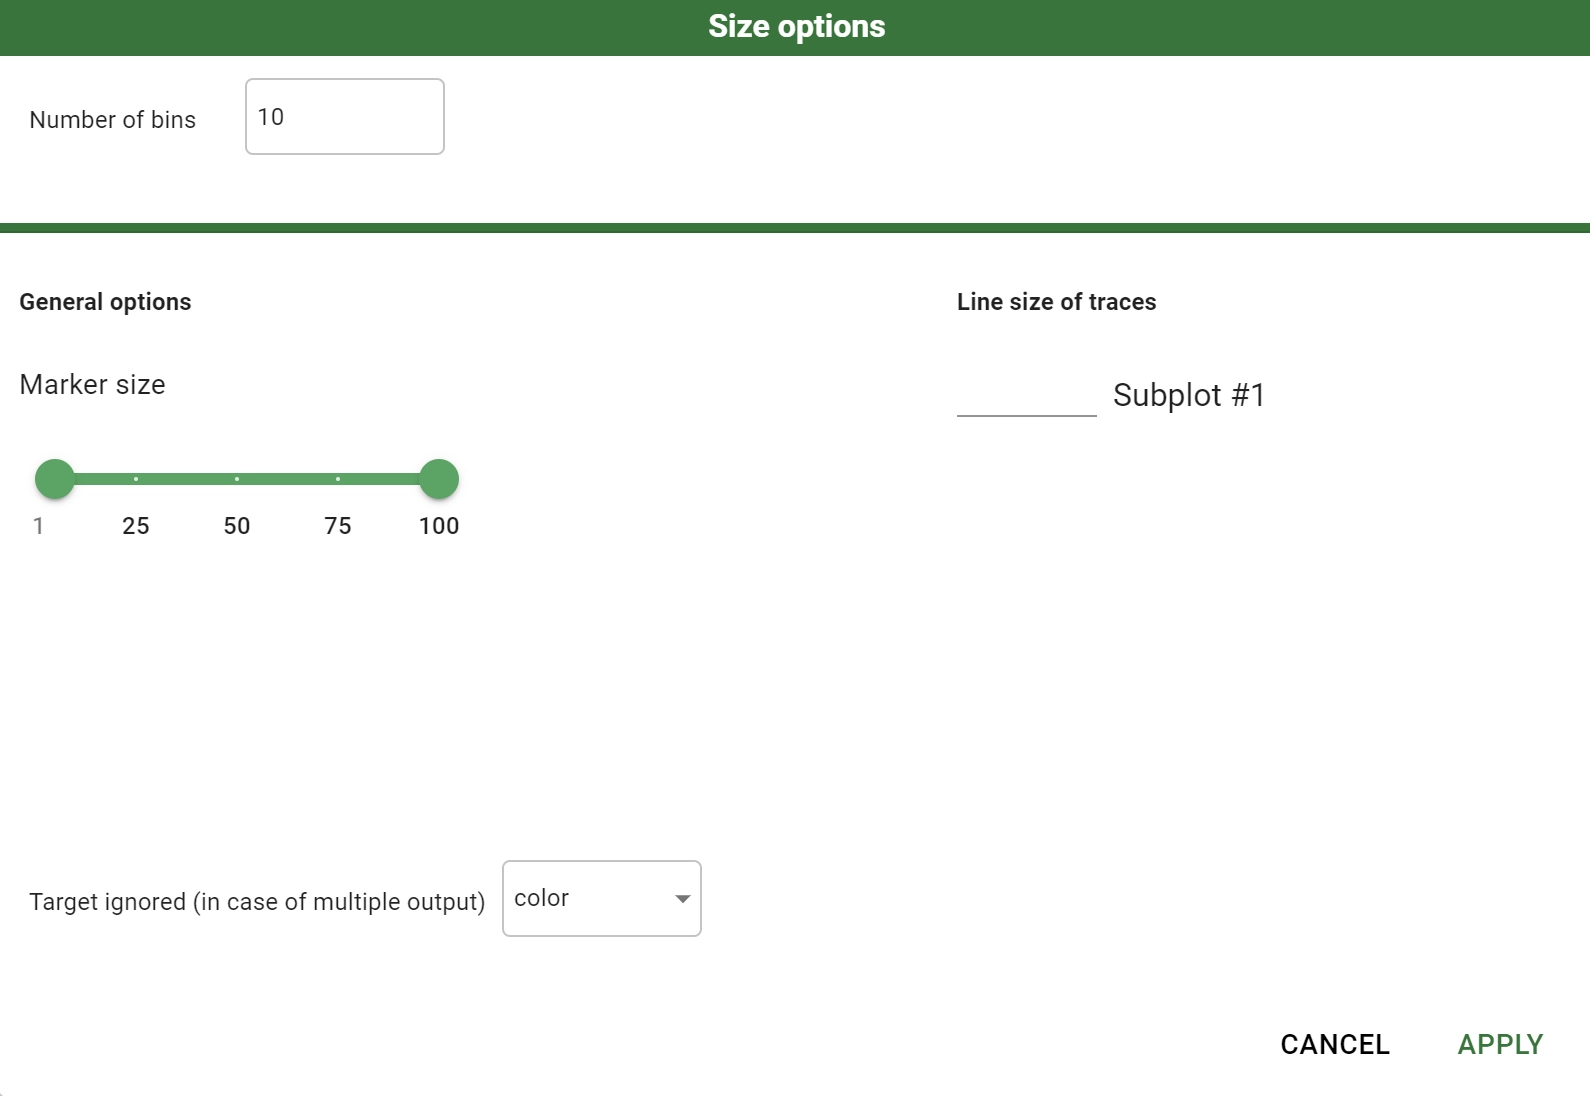
In the default configuration part on the left users can change:
Line size range: by default, the line width spans from a minimum of 1 to a maximum of 10. This range can be reduced by operating on this slider.
Marker size multiplier: if the plot is configured to display both line and points, the size of markers is deduced by the width of the line through the application of a marker size multiplier. Users can change this value to reduce/increase the distinction between points and line in the same trace.
On the right side instead, a list of all the available traces with the corresponding associated size is drawn. Here users can refine the various sizes in their plot by working directly on the final single trace.