K-Nearest Neighbor Regression
The K-Nearest Neighbor Regression (KNN) task detects the output of a new example based on its nearest neighbors.
Specifically, when given an input vector x, the algorithm identifies its k-nearest neighbors, and assigns x to the average output computed within this subset of examples.
The task is divided into three tabs:
The Options tab, where users can choose the attribute they will work on and with.
The Points tab, where users can visualize the points used for the K-Nearest Neighbor Regression task.
The Results tab, where users can visualize the results of the computation.
The Options tab
The Options tab presents the following structure:
Available attributes, where users will find the dataset’s attributes.
Attributes drop area, where users can drag the chosen attributes.
Customization pane, where users are able to customize different options.
Available Attributes
Within this pane, users will find a list of all the dataset’s attributes. To search for a specific attribute, use the lens icon located at the top right of the panel. Users can also sort the attributes according to their preferences. They can choose from a drop-down list of the Order by option:
Attribute
Name
Type
Ignored
Role
Attributes Drop Area
The attribute drop area is divided into two panes:
The Input attributes pane, where users need to put the attributes they want to use to build the network. This operation can be done via a Manual list (users need to manually drag & drop the selected attributes onto the pane) or via a Filtered list.
The Output attributes pane, where users need to put the output attributes they want to use to build the model. This operation can be done via a Manual list (users need to manually drag & drop the selected attributes onto the pane) or via a Filtered list.
Customization Pane
Within this pane, users can set the following options:
Normalization for input attributes: the type of the normalization to use when treating ordered variables.
Available values are:
None
Attribute
Normal
Minmax [0,1]
Minmax [-1,1]
Normalization for output attributes: the type of normalization to use when treating ordered (discrete or continuous) variables.
Available values are:
None
Attribute
Normal
Minmax [0,1]
Minmax [-1,1]
Aggregate data before processing: if selected, identical patterns will be aggregated and considered as a single pattern during the evaluation phase.
Initialize random generator with seed: if selected, a seed that sets the starting point in the sequence will be used during the randomization process.
Append results: if selected, the results of this computation are appended to the dataset; otherwise, they replace the results of the previous computation.
The Points tab
The points used for the K-Nearest task can be viewed within this tab. If no aggregation is carried out and no attributes are ignored, this corresponds to the training set table. In many cases, this table is considerably different from the training set and is therefore displayed separately.
The Results tab
In the Results tab, users can visualize statistics on the KNN computation.
This tab is divided into two panes:
General Info
Within this pane, users can find the following information:
Task Label
Elapsed time (sec)
Result Quantities
Within this pane, users can view the following options:
Number of input attributes
Number of samples
These checkboxes are checked by default.
On the right of the Number of samples checkbox, users, through a drop-down list, will be able to visualize the following options:
Train
Test
Valid
Whole
Example
The following example uses the Adult dataset.
After having imported the dataset via an Import from Text File task, split the dataset into two subsets (test and training set; 30% test and 70% training) with a Split Data task.
Add a K-Nearest Neighbor Regression task and link it to the Split Data task.
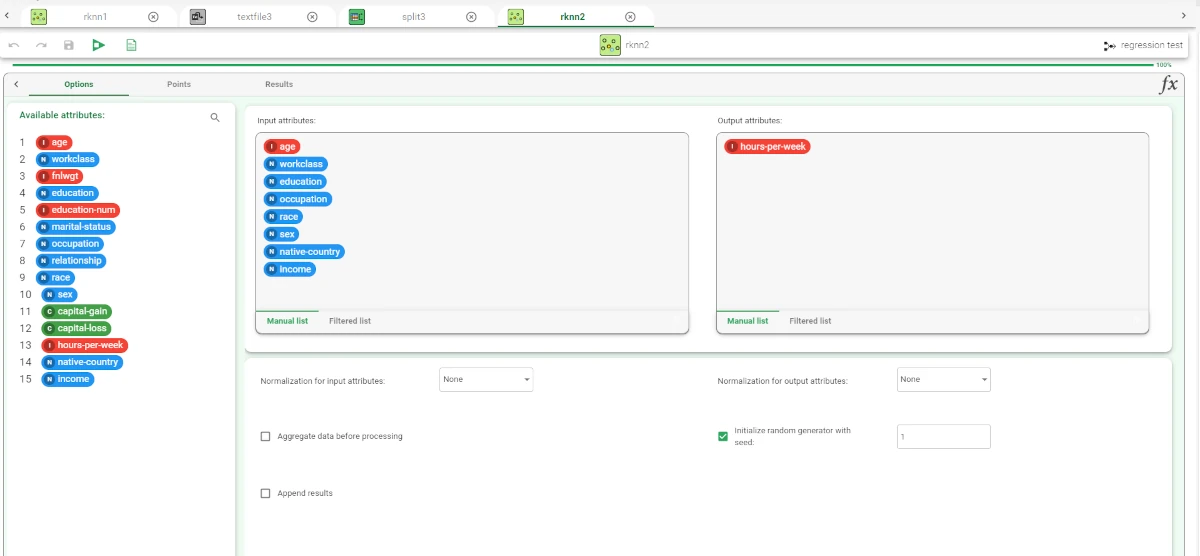
Open the K-Nearest Neighbor Regression task and specify the following parameters:
Output attributes: hours-per-week
Input attributes: age, workclass, education, occupation, race, sex, native-country, income.
Save and compute the task.
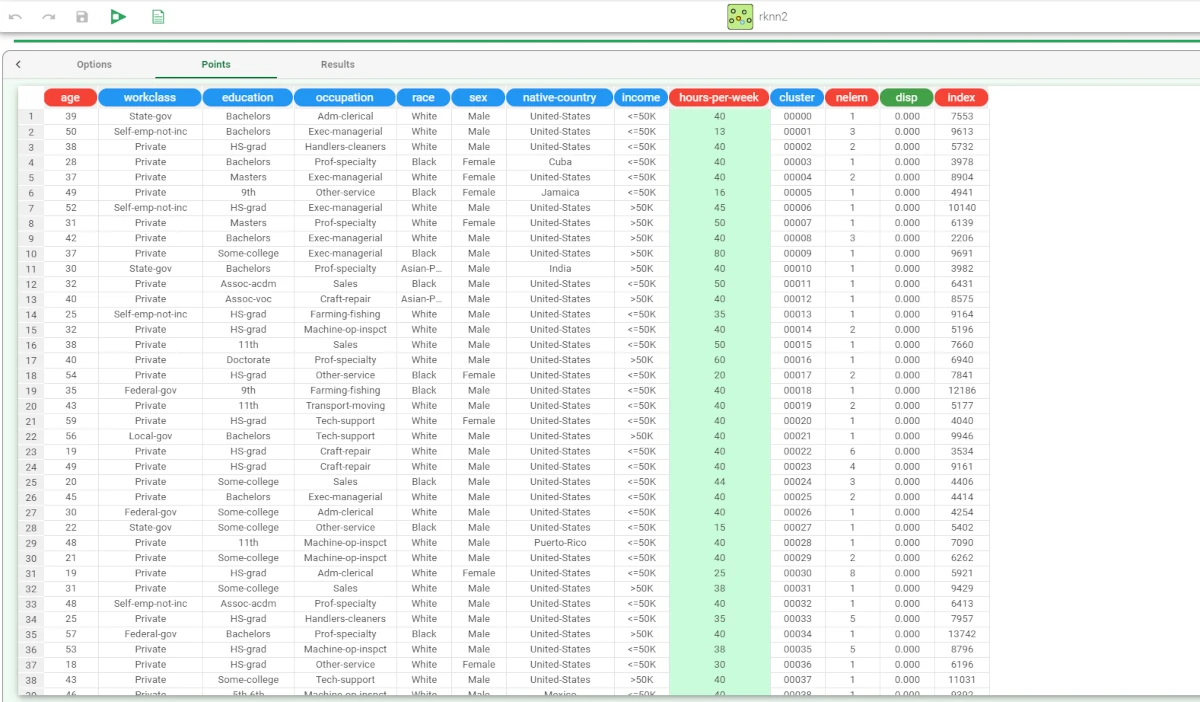
In the Points tab, users can view the points (generated from the training set after an aggregation procedure) that will be used to perform the KNN regression operation.
The set of generated structures can be viewed by adding an Apply Model task to the K-Nearest Neighbor Regression task and computing it with default options. In the Apply Model task it is possible to select the number of nearest neighbors to be considered (i.e. the value of k): in this case, set 5 as the Number of points used.
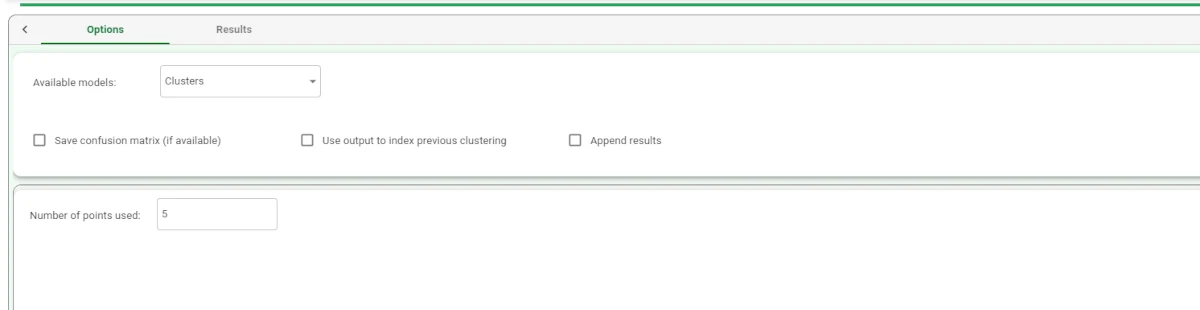
Save and compute the Apply Model task.
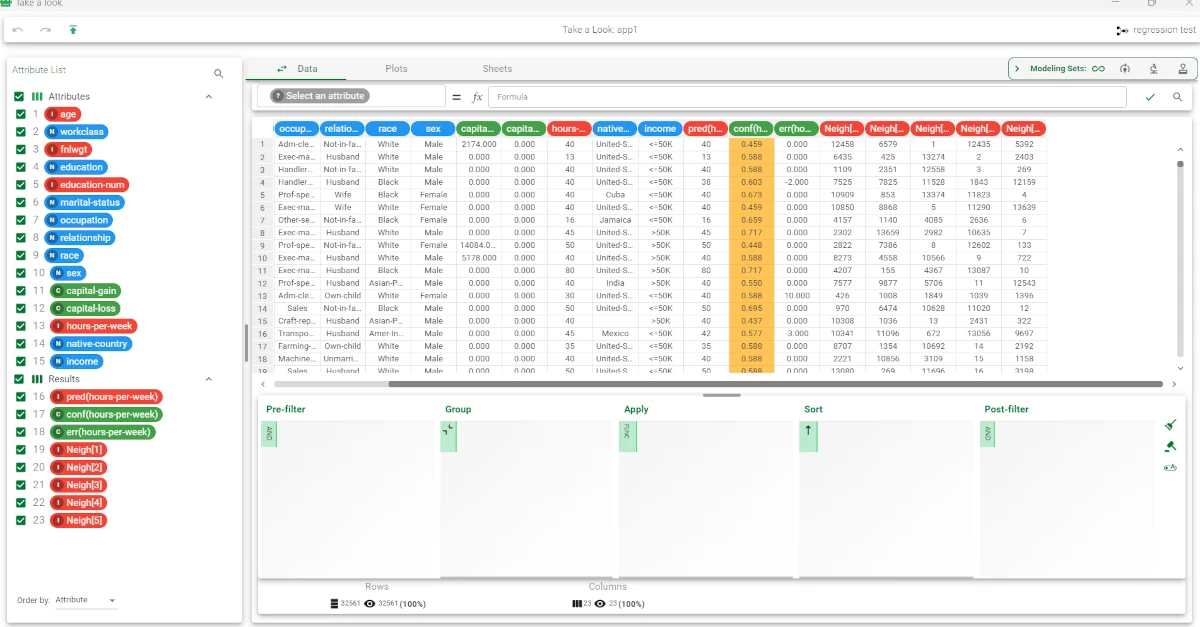
Right-click on the Apply Model task and select Take a look and evaluate the accuracy of the model. The application of the structures generated by the K-Nearest Neighbor Regression task has added columns containing:
the output forecast for each pattern: pred(hours-per-week).
the confidence relative to this forecast: conf(hours-per-week).
the error, i.e. the difference between the predicted and actual outcome. If the output is missing, this field is left empty: err(hours-per-week).
the columns from Neigh[1] to Neigh[5] contain the indexes of the nearest neighbors.