Rule Viewer
The Rule Viewer is a task designed to visually explore rules through an interactive graphic that changes based on chosen parameters. It gives users comprehensive information about the most important rules, their attributes and the relationship between output and input attributes.
For instance, this task can be used to analyze the set of rules generated by the Classification LLM task.
Rule Viewer layout
Information such as the name of the output attribute for classification problems, the number of rules and how to read the colors in the graphic are provided in the color legend, located on the left-hand side of the stage.
In the center of the stage, users will find the graphic displaying all the rules.
- On the right of the stage, users will find:
an information icon which displays a legend to help with the reading of the graphic; it contains graphical explanations for each characteristic of the circle.
a customizable visualization options icon.
Attributes space filters In relation to this option, users can customize the following features to suit their preferences:
the Nr. of attributes to be shown by sliding the bar to the right or left.
the Relevance Threshold by sliding the bar to the right or left.
Sort attributes by:
Absolute Relevance
Output values
Export Rule Viewer. If users click on the PNG icon, they can choose to export their task in PNG format.
The interactive graphic is divided into two separate parts:
an Internal rules space which displays the rules.
an External rules space which shows the attributes included in the rules.
Internal rules space
The internal rules space displays circles that correspond to specific rules.
Each circle represents the covering of a rule - the percentage that filtered rules must respect - with the size of the circle being proportional to the covering. The bigger the covering of the rule, the bigger the circle.
The hole inside the circle corresponds to the error committed by that rule. The bigger the hole, the higher its error percentage.
Moreover, the color of each circle matches the output class color as defined in the legend.
The ruleset is further organized into subsets of circles that contain rules with the same output class.
As mentioned above, the entire internal rules space is interactive.
Users can hover over the circle representing a subset of rules to view the number of rules in a class. The legend on the left of the screen displays the following information:
Output value
Covering
Conditions
External rules space
The external rules space shows the attributes included in the rules.
The attribute ring is a pie chart in a specific order where each slice depicts an input attribute. A slice normally consists of several sections representing the different values that the attribute to which it belongs can take within the whole ruleset. The chart follows a clockwise order and begins with the attribute at the top of the chart (at 12 o’clock), with the most relevant attributes displayed first, starting at 1 o’clock (see the Feature Ranking page for details). The attribute space is highly interactive: by clicking on an attribute name, users can open the slice and read all its individual values.
To view relevant information based on the classes defined in the legend, hover over an attribute name or its corresponding variable type icon. The highlighted rules indicate the attribute used in one of the rule conditions.
Hovering over a particular section of the slice will display information about that set of values for the attribute. The section’s color corresponds to the output class color of the rules it primarily satisfies. The level of transparency represents the relevance of the attribute itself. The highlighted rules are those where the attribute is used in at one of the rules’ conditions.
Example
After having imported the dataset via an Import from Text file task and having randomly split the dataset into two subsets (test and training set; 30% test and 70% training) with a Split Data task, add a LLM Classification task and link it to the Split Data task.
Add a Rule Viewer task and link it to the LLM Classification task.
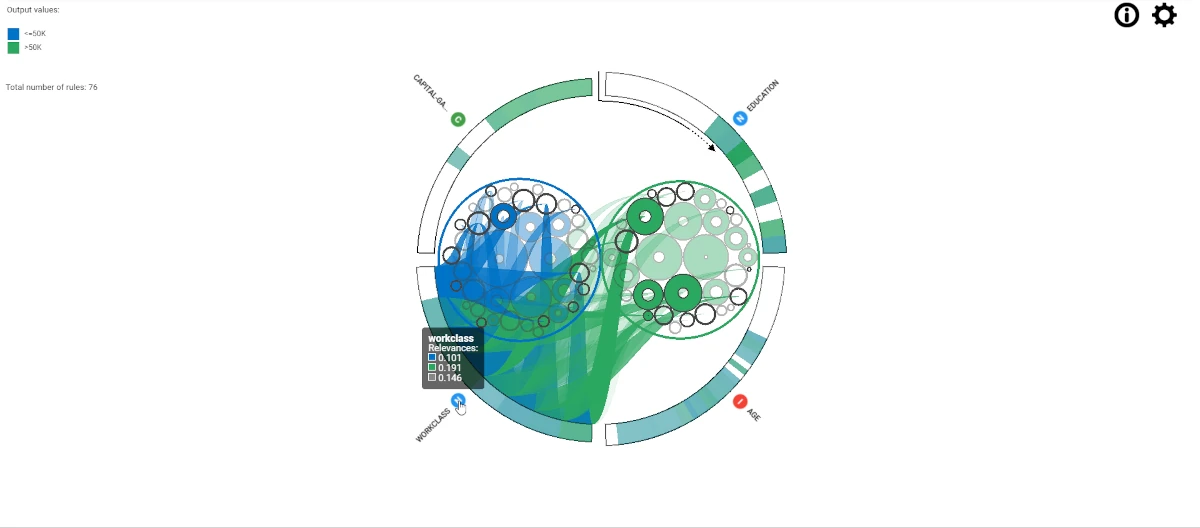
Open the Rule Viewer task. On the left of the stage, users can visualize the Output values and the Total number of rules. By hovering over the external space, users can see the Relevance to the point of the circle on which they are hovering.
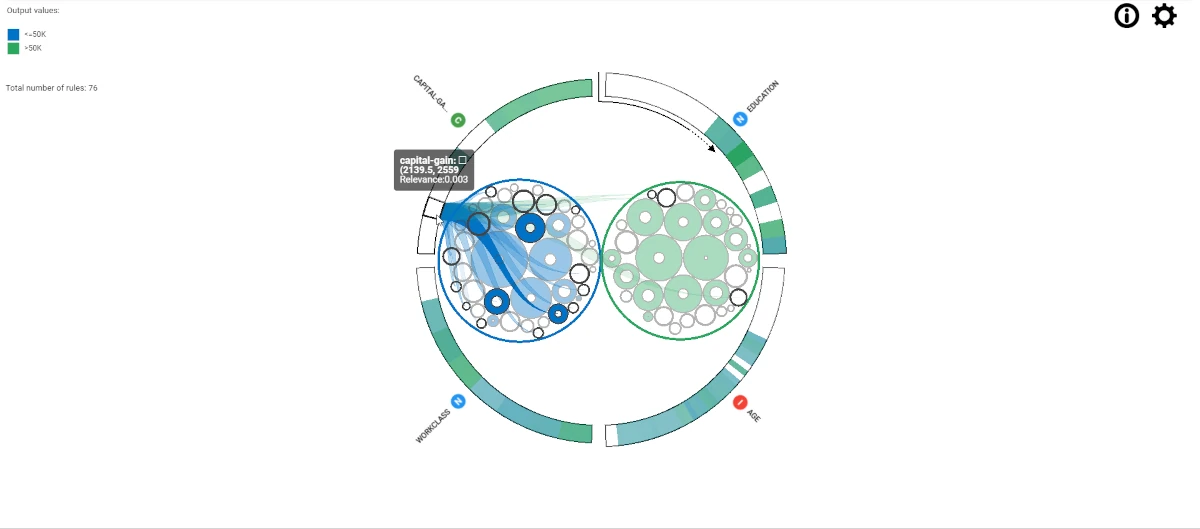
If users hover the mouse over a single rule circle, all the associated values will be highlighted and graphically linked to the circle. The Relevance of the condition can be seen through its transparency.

Hover over an attribute name or its variable type icon to view information about the relevance of the attribute according to the classes defined in the legend. The highlighted rules are those in which the attribute is used in one of the rule’s conditions.