Discretize
Discretization transforms continuous data by defining a set of cutoffs that subdivide a continuous domain into a finite set of homogeneous intervals.
The points in each interval should have a high probability of belonging to the same class. These intervals increase the effectiveness of data in the creation of predictive models.
The Discretize task provides you with all the tools you need to perform this operation without writing a line of code, and you can decide to use supervised discretization methods, or to discretize the output itself, too.
Additionally, you can also use discretization cutoffs which have already been defined in upstream flow tasks.
You can then take a look to the generated cutoff points by importing them through an Import from Task task.
The task interface is divided into three tabs, which will be analyzed in the sections below:
The Options tab
The Monitor tab
The Results tab
The Options tab
In the Options tab, you can configure the task according to the source dataset(s) and to the desired result. It is divided into two main sections:
The Available attributes list, where you can find the attributes of the source dataset.
- The so-called configuration section. Here you can set the following parameters:
Use previous cutoffs to discretize dataset: if selected, the cutoffs defined in an upstream Discretize task will be used to discretize the new data, instead of defining new cutoffs. This is useful when you want data to be discretized in the same way in various points of the flow.
Attributes to discretize: drag and drop the ordered attribute you want to transform from the Available attributes list.
- Method for discretization: Select the method you want to use from the Method for discretization drop-down list. Possible values are:
Attribute Driven Incremental Discretization (default choice): it is a top-down method that recursively adds separation points (cutoffs) for each discrete or continuous attribute. The method is designed to obtain a complete separation of the points of the training set, i.e. the discretization process must not generate ambiguities. This method is supervised and requires an output attribute.
ChiMerge: bottom-up chisquare-based technique that iteratively merges adjacent intervals according to a statistical measure of their similarity. This method is supervised and requires an output attribute.
Entropy: this top-down method recursively adds cutoffs according to a measure, based on entropy, of the information gain achieved by splitting an interval into two. This method is supervised and requires an output attribute.
Equal width: creates intervals of the same amplitude regardless of the output value. This method is unsupervised, and does not require an output value.
Equal frequency: creates intervals containing the same number of patterns regardless of the output value. This method is unsupervised, and does not require an output value.
Roc Curve: uses the ROC Curve to find the best cut-off. This method is supervised and requires an output attribute.
Aggregate data before processing: if selected, identical patterns will be aggregated and considered as a single pattern during the discretization phase.
Minimum distance between different classes: specifies the minimum distance that must be kept between two patterns of different classes, as the percentage of the total number of attributes. This distance is computed as the number of attributes whose values are different in the two patterns. The minimum and default distance is zero. If you select 100% all the attributes of each couple of heterogeneous patterns must differ. This is not always possible since many attributes can have the same value in the starting data, and in this case the method uses the available separations.
Output attribute: select the output attribute to be used for discretization from the drop-down list. Output attributes are mandatory for supervised methods.
Number of patterns used for discretization (-1 means ‘all’): specifies how many patterns will be used. This option allows you to use only a randomly selected subset of the training set, which is particularly useful when there is a high amount of data, as a high number of patterns considerably slows down the discretization process. The default value of -1 means that all patterns will be used.
Discretize output (if ordered): if selected the output attribute will be discretized. This option is available if you have selected a discrete (e.g. integer) or continuous output attribute. You can then select the required discretization method in the Discretization method for output option.
Number of values for ordered variables (0 means ‘automatic’): specifies the number of cutoffs to be inserted for each variable, which must not exceed the number of values available in the training set. The number of cutoffs must at least ensure that the minimum distance between different classes can be guaranteed.
- Discretization method for output: select the discretization method you want to use to discretize the output. This option is only available if you have selected the Discretize Output option. Possible methods are:
Equal Frequency to create intervals that contain the same number of patterns (up to border effects), or
Equal Width, to create intervals of the same amplitude.
Preselect best cutoffs (faster): if selected, the most promising cutoffs will be selected and employed in the subsequent phase. This consequently reduces the number of possible cutoffs to be analyzed. This works particularly well if coupled with the Attribute Driven Incremental Discretization method.
Number of cutoffs for output: specifies the number of cutoffs to be created for the output. The default is 10 whereas 0 means that all possible cutoffs must be inserted.
The Monitor tab
After the execution of the Discretize operation, the Monitor tab displays histograms illustrating the distribution of the number of generated cutoffs. These plots are then only available at the end of the computation.
If you hover over the histogram, some basic information will be displayed, for example:
Count
Range
Percentage on total
Percentage on bar
The Results tab
The Results tab contains summary information on the performed computation. It is divided into two areas:
- The General Info area contains the following information:
Task label
Elapsed time (sec)
- The Result Quantities area, where you can visualize the Number of samples by clicking on the arrow button to open all its sections, which are:
Average number of cutoffs for an attribute
Maximum number of cutoffs for an attribute
Minimum number of cutoffs for an attribute
Number of attributes to be discretized
Number of continuous attributes
Number of input attributes
Number of integer attributes
Number of patterns for discretization
Number of samples
You can check or uncheck the quantities above to either visualize or hide them in the results list.
Example
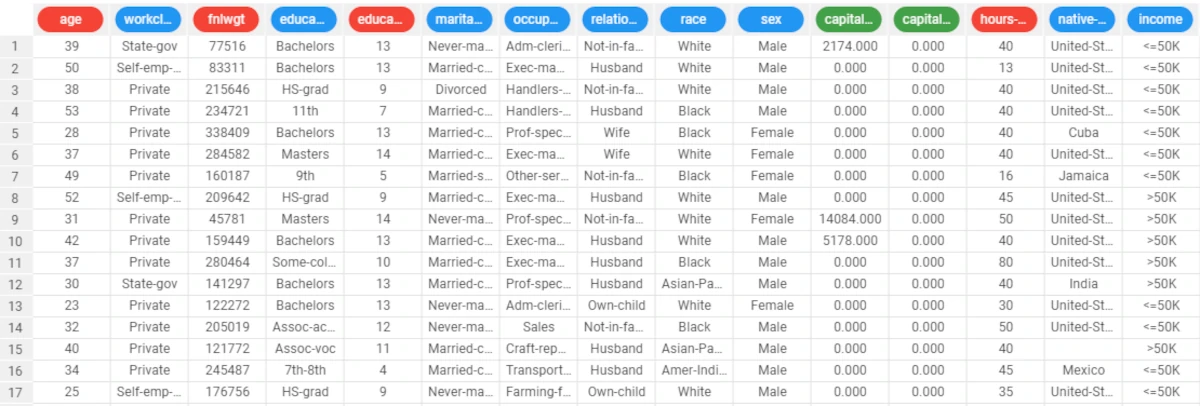
The following example uses the Adult dataset.
After having imported the dataset, right-click on the task and select Take a look to check all the data have been correctly imported.
The original dataset is made up of 32561 records, and the age attribute includes almost all the possible integer values between 17 and 90.
We want to group all these possible values into 5 groups of equal frequency.
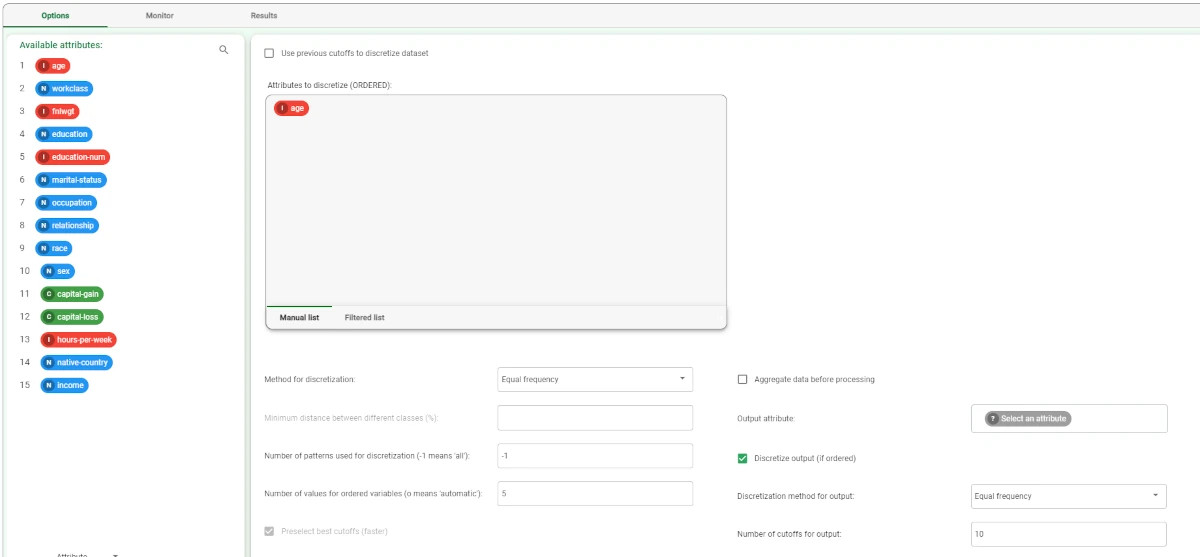
- Drag a Discretize task onto the stage and link it to the import task. Double-click on it to open it. Specify the following:
Attributes to discretize: age
Method for discretization: Equal frequency
Number of values for ordered variables: 5 (in order to create 5 separate groups).
Save and compute the task.
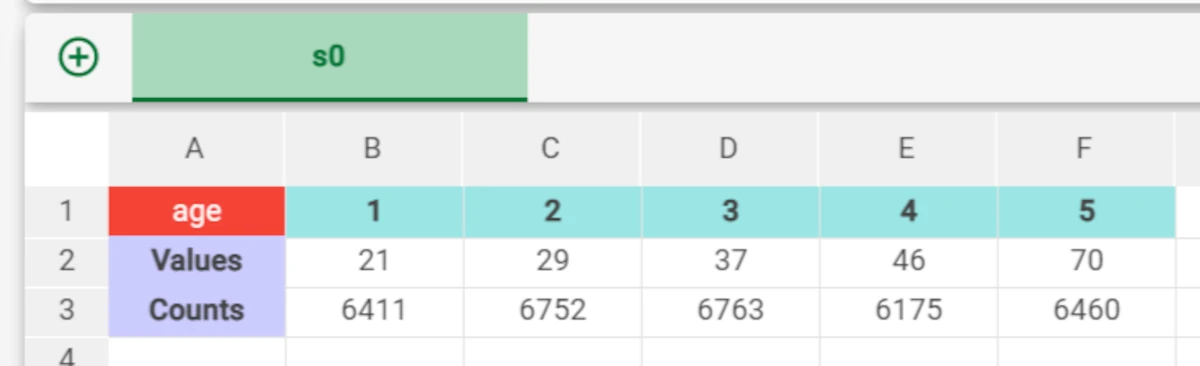
To visualize the discretization results, add a Data Manager to the flow and link it to the Discretize task.
In the Statistic panel of the Sheets tab, drag the age attribute onto the Var_1 input area. Then, choose the Values, frequencies and quantiles statistic from the drop-down list in the Statistics area.
Here you can see the five groups that have been created, with their assigned average values, and the number of rows belonging to each group.