SVM
The SVM task trains a Support Vector Machine for classification. The SVM model uses a kernel function (a generalization of scalar product) to find the optimal separating surfaces in data.
The output of the task is a model, containing a weight matrix wji, that can be employed by the Apply Model task to perform the SVM forecast on a set of examples.
The SVM task is divided into three tabs:
the Options tab
the Monitor tab
the Results tab
The Options tab
The Options tab contains all the options you can customize to obtain the desired output. It is divided into two tabs, the Basic and the Advanced tabs.
The Available attributes list, containing the dataset’s attributes available for the analysis, is always displayed on both tabs.
Basic
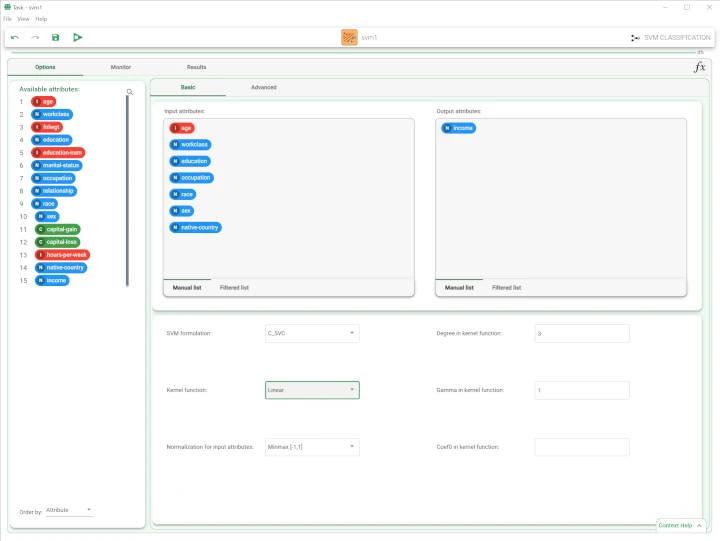
In the Basic tab, you can distinguish between three panels: the Available attributes, containing the dataset’s attributes, which can be dragged onto the second panel, the attribute drop area, to start the analysis. One last panel with general options for analysis is provided.
Drag the required attributes for analysis on the attribute drop area. The following areas are provided:
Input attributes: the input attributes you want to use to form the rules leading to the correct classification of data. Instead of manually dragging and dropping attributes, they can be defined via a filtered list.
Output attributes: the attributes you want to use to form the final classes into which the dataset will be divided. Instead of manually dragging and dropping attributes, they can be defined via a filtered list.
The basic options panel is located under the attribute drop area and contains the following options:
- SVM formulation: select the formulation for the SVM problem. Possible choices are:
C_SVC
NU_SVC
Degree in kernel function: specify the value of the parameter d in the kernel function.
Note this parameter is only required for Polynomial kernel functions.Kernel function: the kernel function. Possible values are: Linear (default), Polynomial, Radial basis function, Sigmoid.
Gamma in kernel function: the value of the Gamma parameter in the kernel function.
- Normalization for input attributes: the normalization type to use when dealing with ordered variables. Possible values are:
None
Attribute
Normal
Minmax[0,1]
Minmax[-1,1] (default)
Coef0 in kernel function: the value of the parameter c0 in the kernel function (only required for Polinomial and Sigmoid kernels)
Advanced
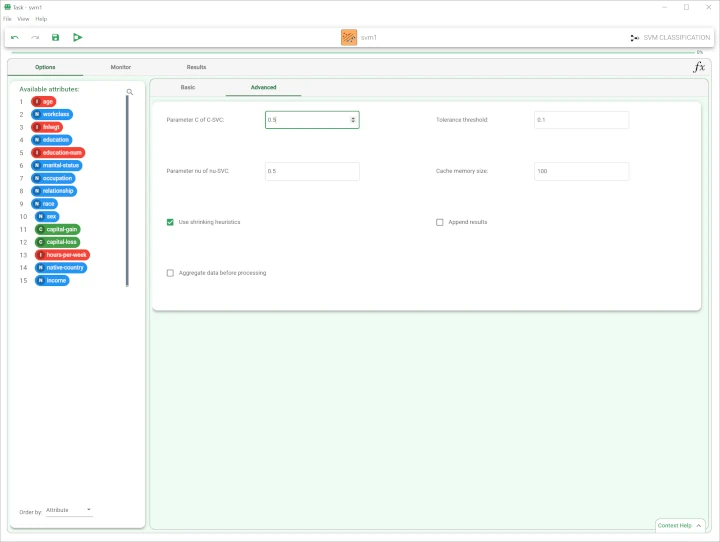
In the Advanced tab, you will find advanced options to customize and complete the analysis. Along with the Available attributes list, you will find the following options:
Parameter C of C-SVC: the value of the parameter C in the SVM formulation.
Tolerance threshold: the tolerance of the terminating criterion.
Parameter nu of nu-SVC: the value of the parameter nu in the nu-SVC formulation.
Cache memory size: the amount of cache that can be used during training.
Use shrinking heuristics: if selected, heuristic methods will be used to speed up computation.
Append results: if selected, the results of this computation are appended to the dataset, otherwise they replace the results of previous computations.
Aggregate data before processing: if selected, identical patterns will be aggregated and considered as a single pattern during the evaluation phase.
The Monitor tab
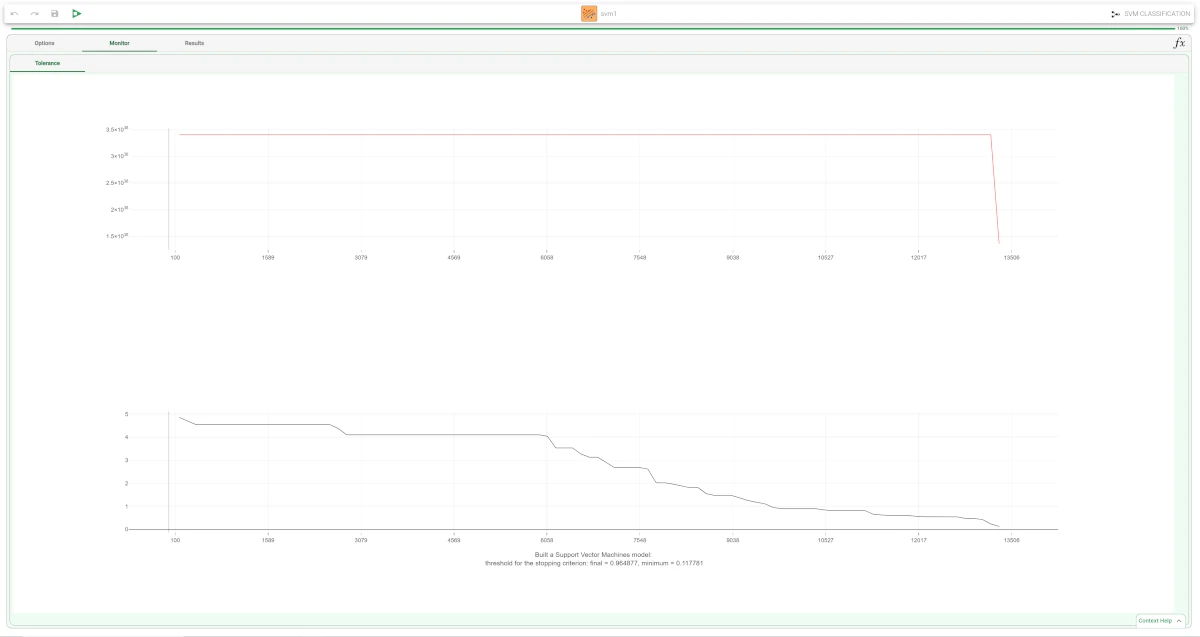
In the Monitor tab, users will find two curve plots referring to the Tolerance, which consist of the analysis’ error, which needs to be analyzed.
The first curve plot, located at the top of the screen, shows the current cost function values. In particular, the X axis contains the Number of iterations, while the Y axis contains the tolerance value.
The second curve plot, located at the bottom of the screen, shows the minimum error values till that moment. In particular, the X axis contains the Number of iterations, while the Y axis contains the tolerance value.
A piece of short information is provided under the second curve plot: it contains the final and minimum values of the threshold for the stopping criterion.
The Results tab
The results tab provides information on the computation. It is divided into two sections:
- In the General Info section, you will find:
The Task Label, which is the task’s name on the interface.
The Elapsed time, which indicates how long it took to complete the computation.
The Total number of iterations
The Dimension of the input space after splitting of attributes
The Number of classes
The Total number of support vectors
- In the Result quantities section, you will find:
The Number of samples obtained, divided by the following sets:
Train
Test
Valid
Whole
Example
After having imported the file with an Import from Text File task and after having split the dataset into training (70%) and test (30%) sets with the Split Data task, drag an SVM task onto the stage.
- Open it and drag the Income attribute onto the Output area, then drag the following attributes in the Input area:
age
workclass
education
occupation
race
sex
native-country
- Configure these options as follows:
SVM formulation: C_SVC
Kernel function: Linear
- Then, open the Advanced tab and configure the following option:
Parameter of C of C-SVC: 0.5000
Leave the remaining default settings, then save and compute the task.
The execution of the SVM task can be viewed in the Monitor tab. In these plots the behavior of the tolerance (and its minimum) as a function of the iteration is shown.
The forecast ability of the set of generated rules can be viewed by adding an Apply Model task to the SVM task, and computing with default options.
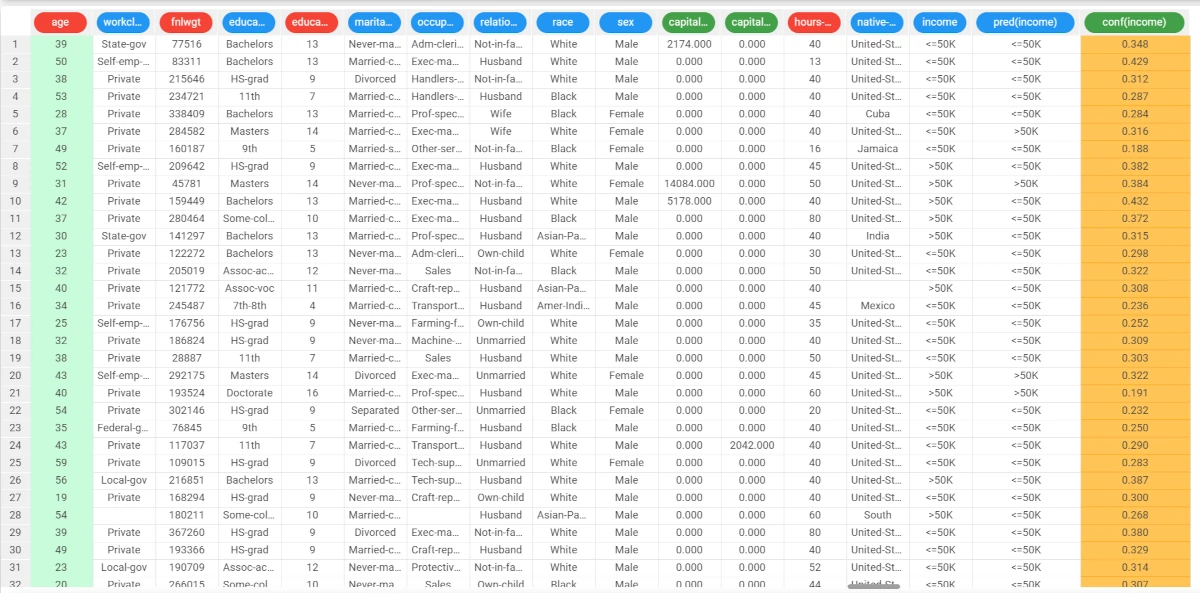
- The forecast produced by the Apply Model task can be analyzed by right-clicking the task and selecting Take a look.
In the data table the following columns relative to the results of SVM elaboration have been added: the SVM output forecast: pred(income)
the confidence of this forecast: conf(income)
- The forecast produced by the Apply Model task can be analyzed by right-clicking the task and selecting Take a look.