The Data Manager
The Data Manager is a central task: it allows you to perform several operations which involve, namely, data management.
With the Data Manager, we can:
see the data which are behind your data management flow in an enhanced sheet base view.
understand whether all the data you require for your model is already included in your data tables, or whether you need to enrich the data tables with additional attributes created through formulas.
aggregate multiple rows to condense information into fewer more significant rows, for example by aggregating all the rows corresponding to a customer in a single row using the Group and Apply operations.
check if data are clear and coherent, for example by checking the attribute types are correctly defined. Note that an incorrect data type may have been incorrectly assigned automatically due to one or more values having been inserted with the incorrect format. If you try to change the data type to the correct type, Rulex Platform will tell you which row contains the format error.
standardize the way missing values are expressed (for example, missing values can be represented with the letters “n/a”, or a question mark).
explore data in the Plot or Sheet tab, to check visibly if the data at hand are appropriate for solving your problem, and detecting and removing any abnormal data (i.e. outliers), which may alter the generated models. Outliers often contain valuable information about the process under investigation or the data gathering and recording process. Before considering the possible elimination of these points from the data, one should try to understand why they appeared and whether it is likely similar values will continue to appear. Of course, outliers are often bad data points.
Thanks to the history management of Rulex Factory manager tasks, any operation performed in the Data manager is saved in code form and can be executed on new data any time. This possibility allows the user to study necessary operations on training data and then to apply them on real or production data without any extra effort. Delivery of developed solutions is then straightforward with tools offered by the self-code framework of Rulex Factory.
Data Manager is divided into two main areas:
An additional pane, The Modeling Sets bar, located next to the Main Data Pane’s tabs, allows the user to select and define different subsets of your dataset which are useful for modeling (training, test or validation sets).
The Attributes List
Located on the left of the screen, the attributes’ pane displays a list of all the available attributes in the current dataset, and allows you to organize them by changing their position, their type, their role. It allows you also to search and sort them, or to add and delete attributes to the current dataset.
To a complete description about the attribute list user interactions is devoted this page. A brief introduction about the structure of this pane is present here in this section. The attribute list is divided into two different sub-lists:
Attributes sublist, which contains all the columns imported by external resources or created from them through pre-processing transformation.
Results sublist, which contains all the columns automatically added by a particular Machine Learning Rulex Factory tasks.
Hint
Even if these two sub-lists are graphically separated, all the operations can be applied indistinguishably to any of these two groups without any modification. This division is mainly a logical division to help the user to understand immediately what is the provided information and what are the constructed results.
These sub-lists can be ordered by using the drop-down menu located at the bottom of the whole pane. Possible ordering are:
Attribute (the default one meaning the original column position of the attribute into the dataset)
Name
Type
Ignored
Role
Each of these ordering will preserve the distinction between attributes and results. The ordering criteria are then applied separately for each sublist (for further information about attribute ignoring and attribute role properties please refer to the dedicated attribute list page)
Next to the top label Attribute list, a Magnifier icon enables the user to search and filter the whole list according to the presence of the entered string. This filter operation applies only to the list itself and does not touch the number or the position of the column eventually shown on the Main Data pane. As explained here the selection of the column to be shown on the main tab is controlled by the present checkboxes rather than the search feature.
See also
Description of the dragging and dropping operations and of the dedicated right-click context menu is postponed in the devoted page
The Main Data Pane
The main data pane shows, organized into different tabs, the whole list of operations a Data Manager can be applied on your data. Functions, queries and direct transformations on rows and columns are performed in the first main tab, while in the subsequent tabs different aspects of the data inspection as plot representation and statistics are taken into account.
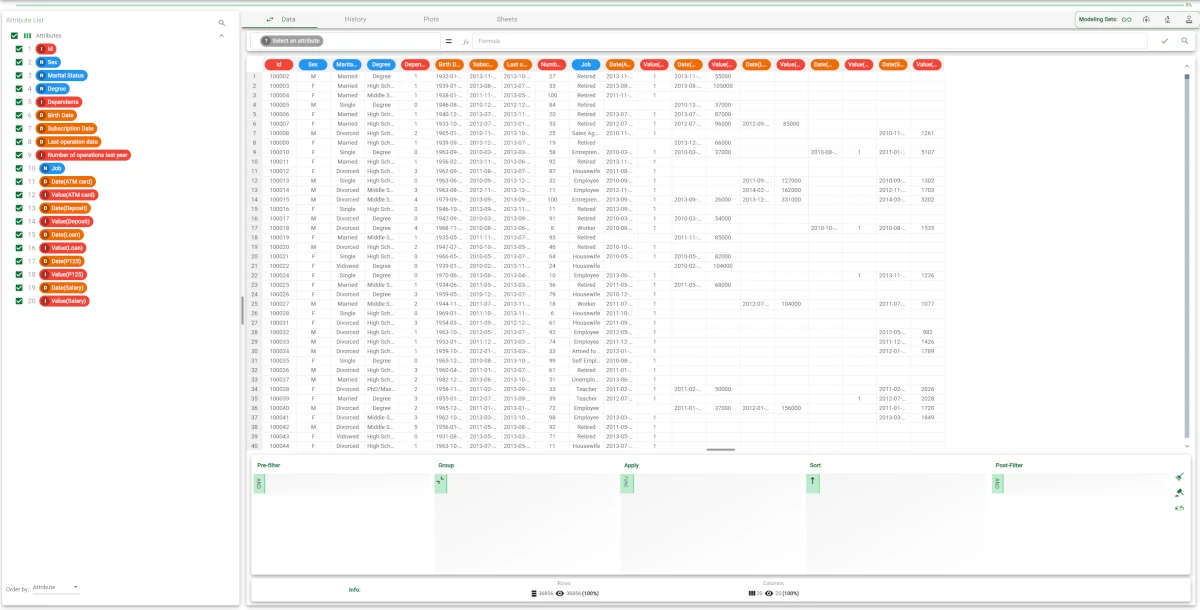
The tabs listed in this pane are:
The Data tab: displays the data as a spreadsheet. It can be switched to the Attributes tab by clicking on the double-arrow button, where you can bulk edit the attributes’ characteristics. For more information on the Attributes tab go to the corresponding page.
The History tab: displays all the operations performed during the current session, and allows you to move or delete some of them.
The Plots tab: displays the plots on data as defined in the Plot Manager.
The Sheets tab: displays the statistics on data as defined in the Sheets tab.
See also
History management is in common with all the other Manager tasks. Therefore, the behavior of the History tab is explained in detail into manager task overview.
The Modeling Sets Bar
In applying a machine learning model, it is used to define three different sets of rows called:
Training set
Test set
Validation set
These are referenced in Rulex Platform as Modeling sets.
The modeling sets bar allows you to filter data according to the different model set each row belongs to. You can also define new modeling sets based on the filter executed in the Query Manager.
Tip
Modeling bar sets is located on the Data manager header bar tab. If its presence disturbs you, you can reduce it by clicking on the Arrow icon located to the left of the whole bar.
Modeling sets bar is composed by four different icon buttons:
All which shows all the dataset rows
Training which shows only the Training set
Test which shows only the Test set
Validation which shows only the Validation set
By right-clicking on any of these button except All you obtain access to the following command:
Assign displayed rows to <button name> set: assign the displayed rows to the specified modeling set.
- The Attribute List
- The Data tab
- Executing a formula
- The Main spreadsheet
- The Query Manager
- The Info row bar
- Executing queries
- Data Manager functions
- The Attributes tab
- Styling dataset columns
- The Plots tab
- The Sheets tab