K-Nearest Neighbour
The K-Nearest Neighbour (KNN) classifier task determines the output of a new example on the basis its nearest neighbors.
In particular, given an input vector x, the algorithm finds its k nearest neighbors and then assigns x to most represented class in this subset of examples.
The output of the task is a structure that can be employed by an Apply Model task to perform KNN forecasts on a set of examples.
The task is divided into three tabs:
the Options tab
the Points tab
the Results tab
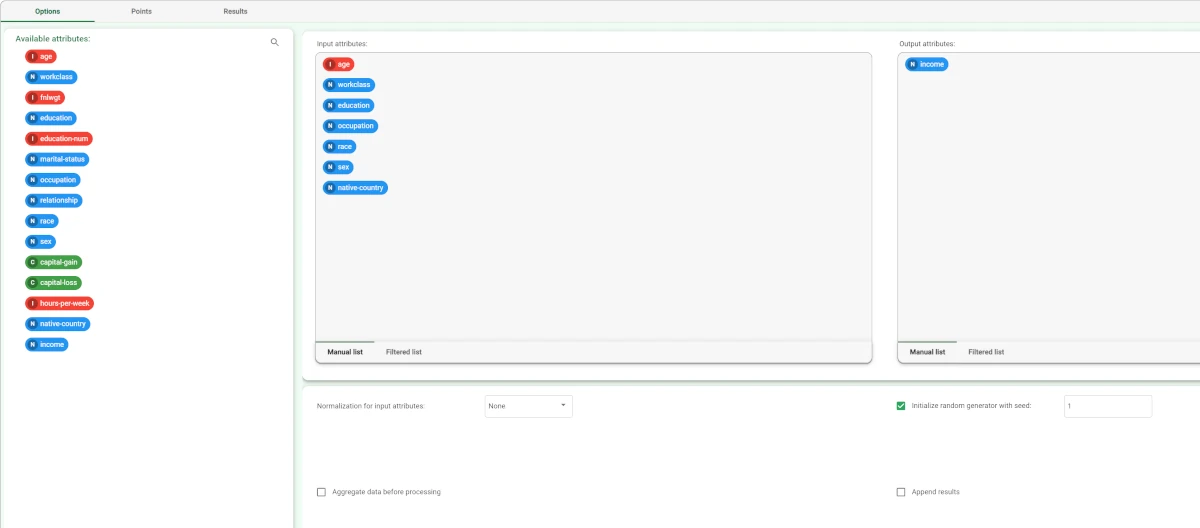
The Options tab
The Options tab contains all the options you can customize to perform the analysis.
It is divided into three main sections:
The Available attributes section, where you will find the dataset’s attributes, which can be dragged onto the attribute drop area. More information on the attribute list can be found at the corresponding page.
The attribute drop area, where you can drag the attributes. Instead of manually dragging and dropping attributes onto the Input attributes and Output attributes, they can be defined via a filtered list.
- The last panel contains the customization options available:
- Normalization for input attributes: the type of normalization to use when dealing with ordered variables. Possible values are:
None (default value)
Attribute
Normal
Minmax [0,1]
Minmax [-1,1]
Initialize random generator with seed: if selected, a seed, which defines the starting point in the sequence, is used during random generation operations.
Aggregate data before processing: if selected, identical patterns will be aggregated and considered as a single patern during the evaluation process.
Append results: if selected, the results of this computation are appended to the dataset, otherwise they replace the results of the previous computations.
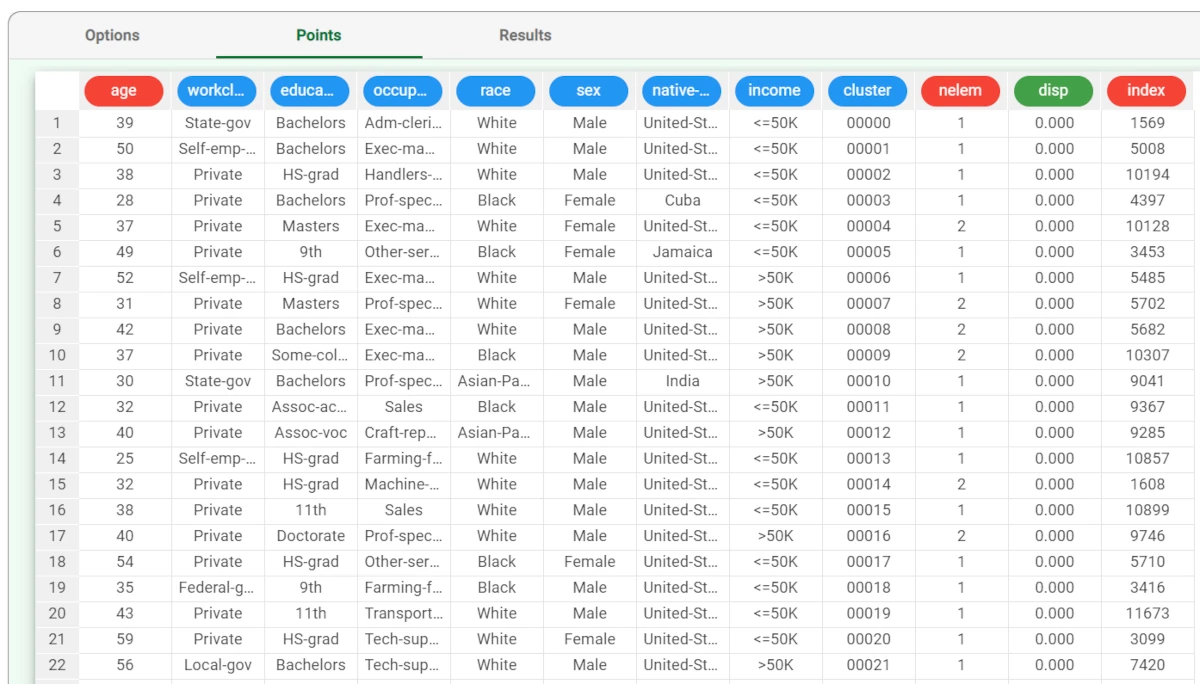
The Points tab
The Points tab displays the points used to perform the classification operation. If no aggregation is performed and no attributes are ignored, this corresponds to the training table. However, in many cases this table significantly differs from the training set and is therefore shown separately.
The Results tab
The results tab provides information on the computation. It is divided into two sections:
- In the General info section you will find:
The Task Label, which is the task’s name on the interface.
The Elapsed time, which indicates how long it took to complete the computation
- In the Result Quantities tab, you will find:
Average covering for a rule (%)
Average error for a rule
Average number of conditions in a rule
Maximum error for a rule
Maximum number of conditions in a rule
Minimum covering for a rule (%)
Minimum error for a rule
Minimum number of conditions in a rule
Number of attributes in rules
Number of distinct samples
Number of rules
Number of samples
You can check or uncheck the quantities above to visualize them in the results list. You can visualize their specific values by clicking on the arrow next to them.
Example
After having imported the dataset with the Import from Text File task and splitting the dataset into test and training sets (30% test and 70% training) with the Split Data task, add a K-nearest neighbor task to the flow.
- Drag the Income attribute onto the output area and the following attributes as input:
age
workclass
education
occupation
race
sex
native-country
Leave the other settings as default, then save and compute the task.
The Points table in K-Nearest Neighbor task contains the points (generated from the training set after an aggregation procedure) that will be used to perform the KNN classification.
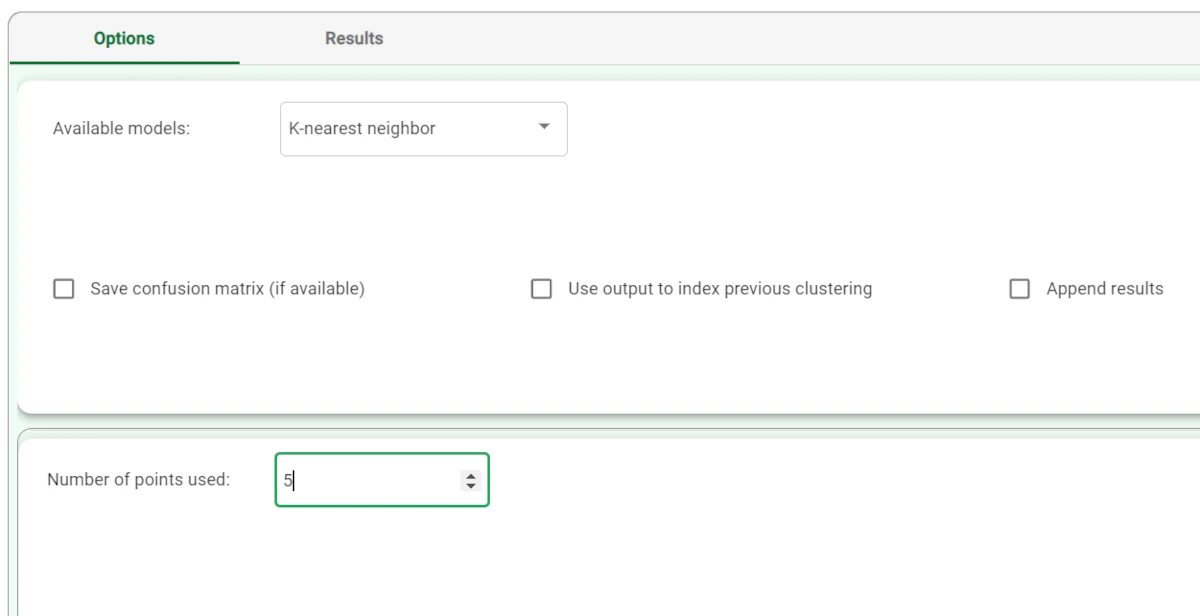
The forecast ability of the set of generated rules can be viewed by adding an Apply Model task to the K-Nearest Neighbor task, and computing with default options.
In the Apply Model task it is possible to select the number of nearest neighbor points to be considered (i.e. the value of k): in this case we will select 5.
We can evaluate the accuracy of the model on the available examples by right-clicking the Apply Model task and selecting Take a look.
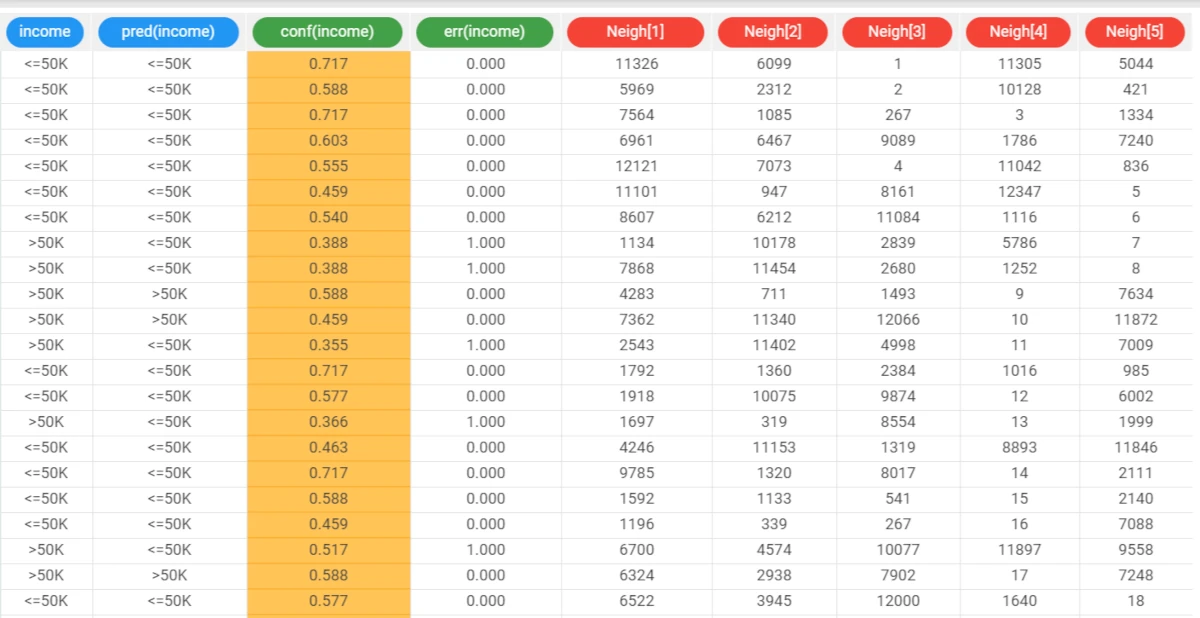
- The application of the rules generated by the KNN task has added new columns containing:
the output forecast for each pattern: pred(income)
the confidence relative to this forecast: conf(income)
the error, i.e. the difference between the predicted and actual outcome. If the output is missing, this field is left empty: err(income).
The columns from Neigh[1] to Neigh[5] contain the indexes of the nearest neighbors. Note that these indexes refer to the Points table in the KNN task.