Regression SVM
The SVM task trains a Support Vector Machine for regression. The SVM model uses a kernel function (a generalization of the scalar product) to find the optimal separating surfaces in data. This algorithm evaluates input attributes and delineates an optimal line that effectively separates the data into various classes, according to the target output attribute.
The Regression SVM task is divided into three tabs:
The Options Tab, where users can choose the attribute they will work on and with.
The Monitor Tab, where users can view the tolerance levels.
The Results Tab, where users can visualize the results.
The Options tab
The Options tab is divided into two tabs: the Basic tab and the Advanced tab.
In the Basic tab, users will find the following structure:
Available attributes, where users will find the dataset’s attributes. It is always displayed on both Basic and Advanced tabs.
Attributes drop area, where users can drag the chosen attributes.
One Customization pane, where users are able to customize different options.
Available attributes
Within this section, users will find a list of all the dataset’s attributes. To search for a specific attribute, use the lens icon at the top right of the panel. Users also have the option of sorting the attributes according to their preferences. They can choose from a drop-down list of the Order by option:
Attribute
Name
Type
Ignored
Role
Attributes drop area
The Attributes drop area is divided into two panes:
The Input attributes**pane, where users can choose the attributes they want to be considered for the classification of data. This operation can be done via a **Manual List (users need to manually drag & drop the selected attributes onto the pane) or via a filtered list.
The Output attributes, where users can choose the attributes they want to use to build the network. This operation can be done via a Manual List (users need to manually drag & drop the selected attributes onto the pane) or via a filtered list.
Customization Pane
SVM formulation. Users can select the formulation for the SVM problem. Available values are:
EPSILON_SVR: this formulation uses the epsilon parameter, through which it is possible to check the error percentage of the model.
NU_SVC: this formulation uses the nu parameter to check the fraction of examples used as support vectors.
Degree in kernel function. Users can specify the value of the parameter d in the kernel function; this parameter is only required for Polynomial kernel functions.
- Kernel function. Users can indicate the kernel function to be used.
Available values are:
Linear
Polynomial
Radial basis
Sigmoid
Gamma in kernel function. Users can specify the value of the parameter γ in the kernel function.
Normalization for input attributes. Users can specify the type of normalization to use when treating ordered (discrete or continuous) variables. Available values are:
None
Attribute
Normal
Minmax [0.1]
Minmax [-1.1]
Coef0 in kernel function. Users can specify the value of the parameter c0 in the kernel function; this parameter is only required for Polynomial and Sigmoid kernel functions.
In the Advanced tab, users can set and configure the following options:
Parameter C of C-SVC. Users can set the value of the parameter C in the SVM formulation.
Parameter epsilon of epsilon-SVR. The ε parameter allows the user to control the number of possible errors in the training set: the higher the number, the higher the number of errors allowed.
Parameter nu of nu-SVC. Users can specify the value of the parameter ν in the nv-SVM formulation. The ν parameter, which must range from 0 to 1, is related to the fraction of examples used as support vectors.
Tolerance threshold. Users can specify the tolerance of the terminating criterion.
Use shrinking heuristics. If selected, heuristic methods will be used to speed up computation.
Cache memory size. Users can specify the amount of cache that can be used during training.
Aggregate data before processing. If selected, identical patterns are aggregated and considered as a single pattern during the training phase.
Append results. If selected, the results of this computation are appended to the dataset, otherwise they replace the results of previous computations.
The Monitor tab
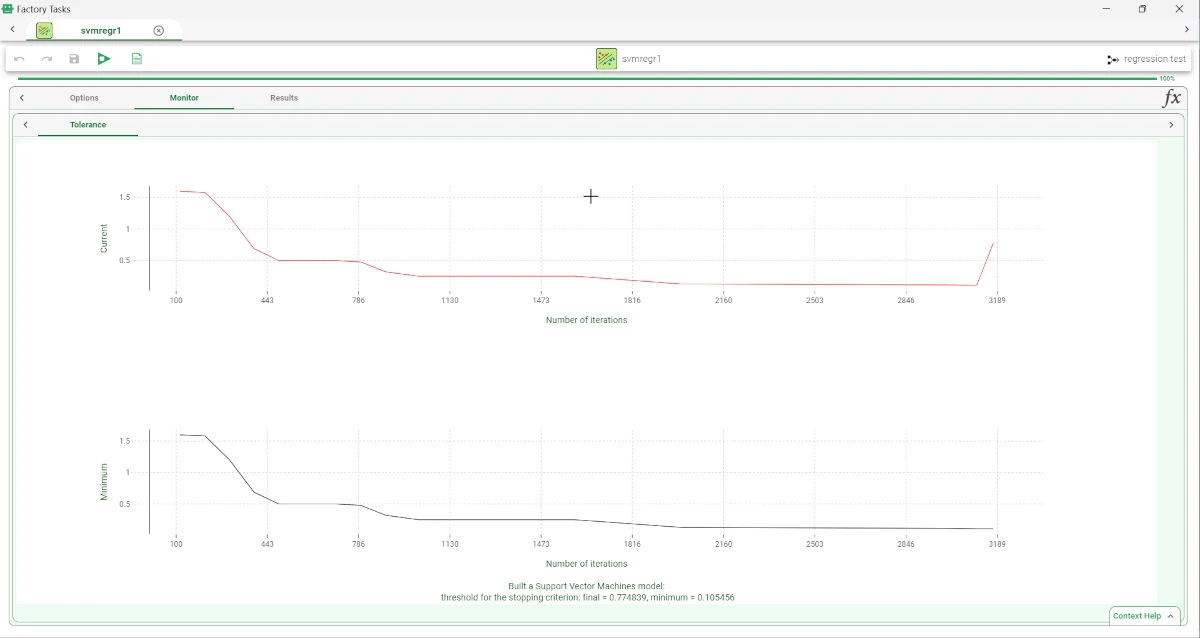
Within the Monitor tab, users will find two curve plots displaying the Tolerance levels. Tolerance represents the error that can occur during the optimization process.
The top curve shows the current value of the function. The lower curve shows the minimum value of the error so far.
The curves contain the following information:
On the X axis: users will see the number of iterations.
On the Y axis: users will see the tolerance value.
The Results tab
Within this tab, users can visualize statistics on the SVM computation.
This tab is divided into two panes:
General Info
Within this tab, users can find the following information:
Task Label
Elapsed time
Result Quantities
Within this pane, users can set and configure the following options:
Dimension of the input space after splitting of attributes
Number of classes
Number of samples
Total number of iterations
Total number of support vectors
These checkboxes are checked by default. Users can view values associated with the selected checkbox on the right.
Example
After having imported the dataset with the Import from Text File task, split the dataset into test and training sets (30% test and 70% training) with the Split Data task.
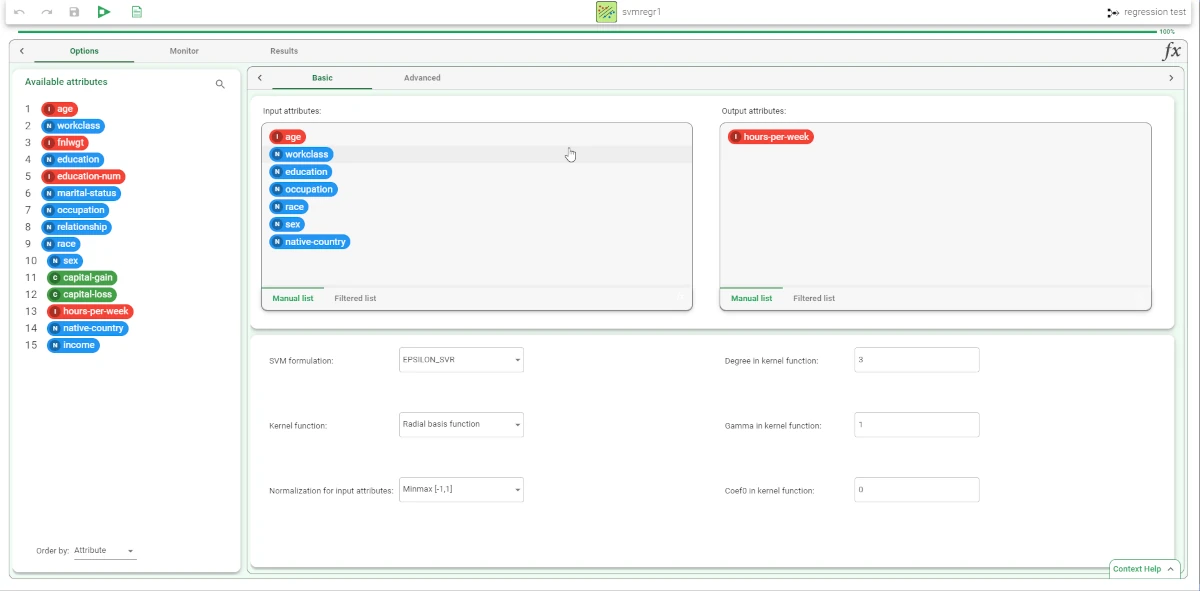
Then, add a Regression SVM task to the flow. Specify the following attributes:
Output attribute: hours-per-week
Input attributes:
age
workclass
education
occupation
race
sex
native-country
income
Save and compute the task.
The execution of the SVM task can be viewed in the Monitor tab. These plots illustrate the behavior of the Tolerance (and its minimum) as a function of the iteration.
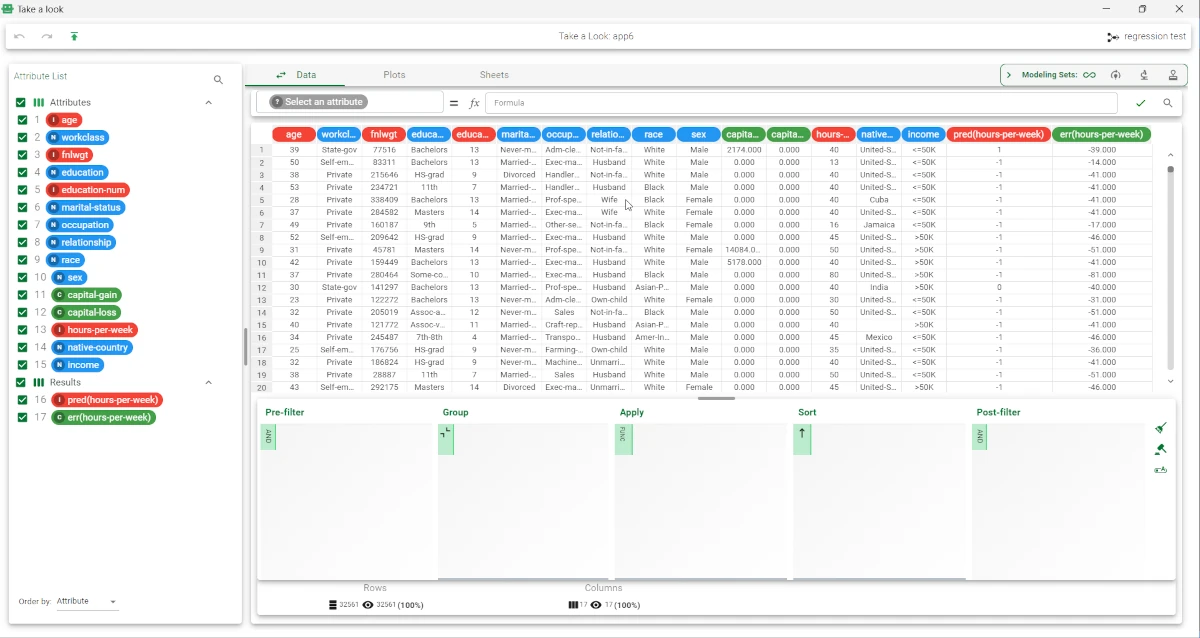
Add an Apply Model task to apply the model to data. The forecast produced can be analyzed by right-clicking the Apply Model task and selecting Take a look.
In the data table the following columns relative to the results of SVM elaboration have been added:
the pred(hours-per-week) column contains the output forecast generated by the SVM model.
the err(hours-per-week) column contains the error, which corresponds to the difference between the predicted output and the real one.