Projection clustering
The Projection Clustering task performs a clustering operation, according to the k-means approach, after having aggregated and filtered data according to a subset of label variables.
Projection clustering ensures that the projection of the set of derived clusters, on the domain of each of the label variables, determines a clustering on that domain. Consequently, the projection of any pair of clusters on the domain of any label attribute never overlap.
The output of the task is a collection of clusters characterized by:
a (positive integer) index,
a central vector (centroid), and
a dispersion value measuring the normalized average distance of cluster members from the centroid. Each cluster is associated with a combination of projected clusters, one for each label variable.
This task is divided into four tabs:
The Options Tab
The Monitor Tab
The Clusters Tab
The Results Tab
The Options tab
The Options tab is divided into two tabs: the Basic and the Advanced tab.
More information on this tab and on its features are available in the clustering tasks homepage.
The Monitor tab
Within this tab, users can view the properties of the new clusters.
More information on this tab and on its features are available in the clustering tasks homepage.
The Clusters tab
The Clusters tab contains a spreadsheet displaying the values of the profile attributes for the centroids of the generated clusters, along with the number of elements and the dispersion coefficient for each of them.
More information on this tab and on its features are available in the clustering tasks homepage.
The Results tab
In the Results tab, users can visualize a summary of the results.
This tab is divided into two panes:
General info, whose features can be found in the clustering tasks homepage.
Result quantities, where users can visualize the following results quantities:
Average dispersion
Average dispersion of clusters
Average weight
Average weight of single samples
Davies-Bouldin index
Dispersion of default cluster
Inter-cluster distance variance
Intra-cluster distance variance
Maximum dispersion
Maximum number of points in a cluster
Minimum dispersion
Minimum number of points in a cluster
Number of clusters
Number of distinct samples
Number of samples
Number of single samples
Number of singleton clusters
PseudoF index (Calinski-Harabasz criterion)
Relative PseudoF index
Example
The current example uses the Adult dataset.
After having imported the selected dataset through an Import from Text file task, drag a Data Manager onto the stage and connect it to the task.
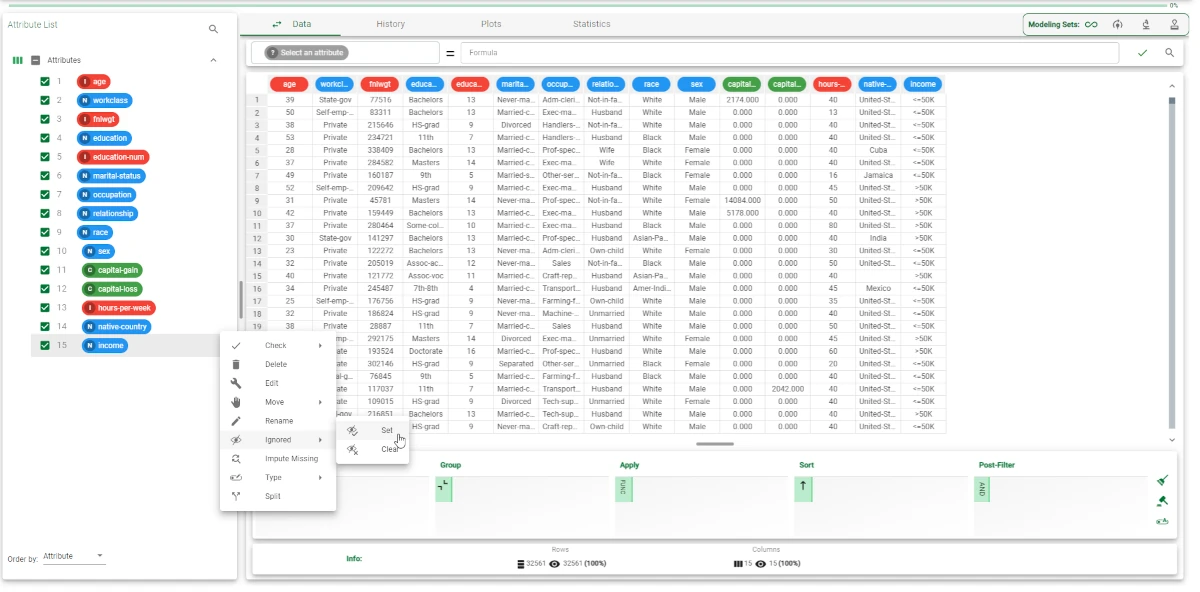
In the Data Manager, right-click on the Income attribute, then select Ignored> Set.
Save and compute the task.
Drag a Split Data task onto the stage to split the dataset into two subsets (30% test set and 70% training set).
Save and compute the task.

Then, drag a Projection Clustering (K-means) task onto the stage and link it to the Split Data task and configure it as follows:
Attributes to consider for clustering: age, education-num, capital-gain, hours-per-week.
Label attributes: workclass, occupation.
Normalization for ordered variables: Normal.
Number of clusters to be generated: 2.
Uncheck the Filter patterns before clustering checkbox in the Advanced tab.
Save and compute the task.

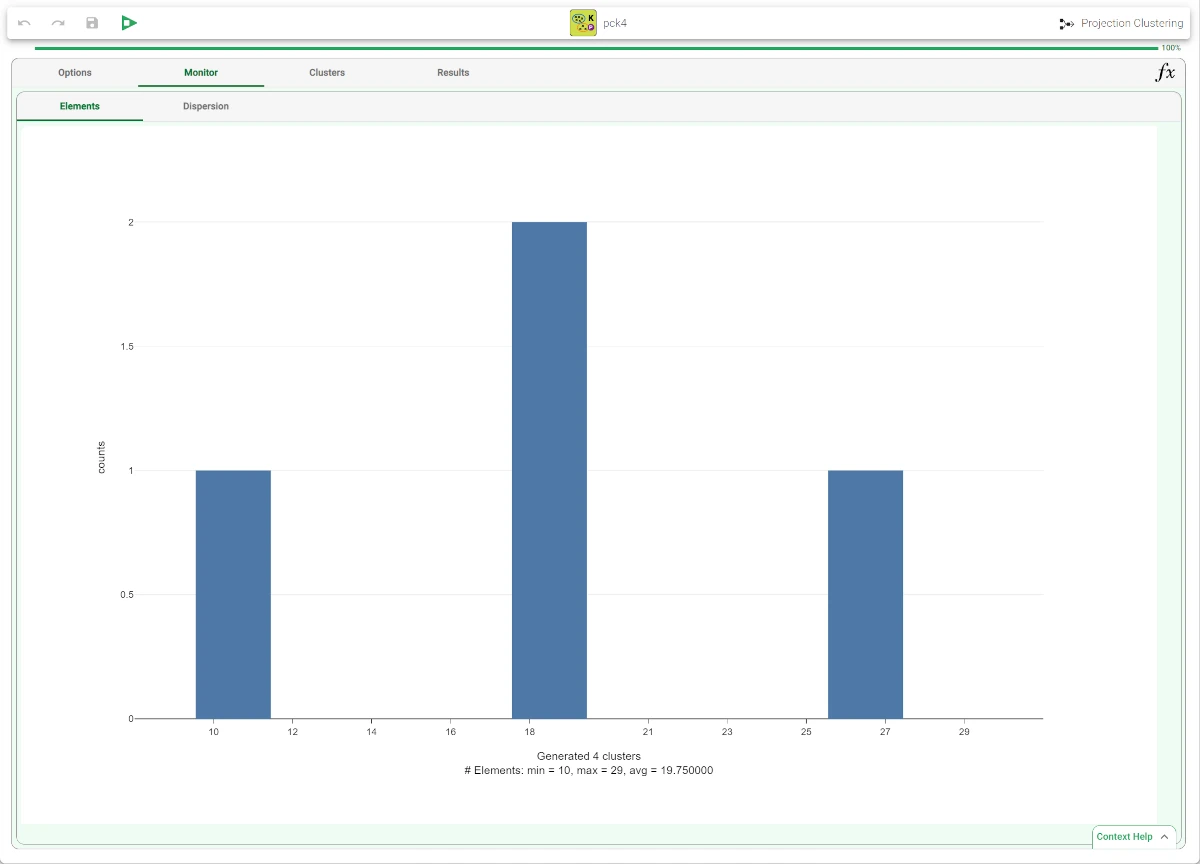
The properties and characteristics of the new generated clusters can be visualized in the Monitor tab and in the Clusters tab.

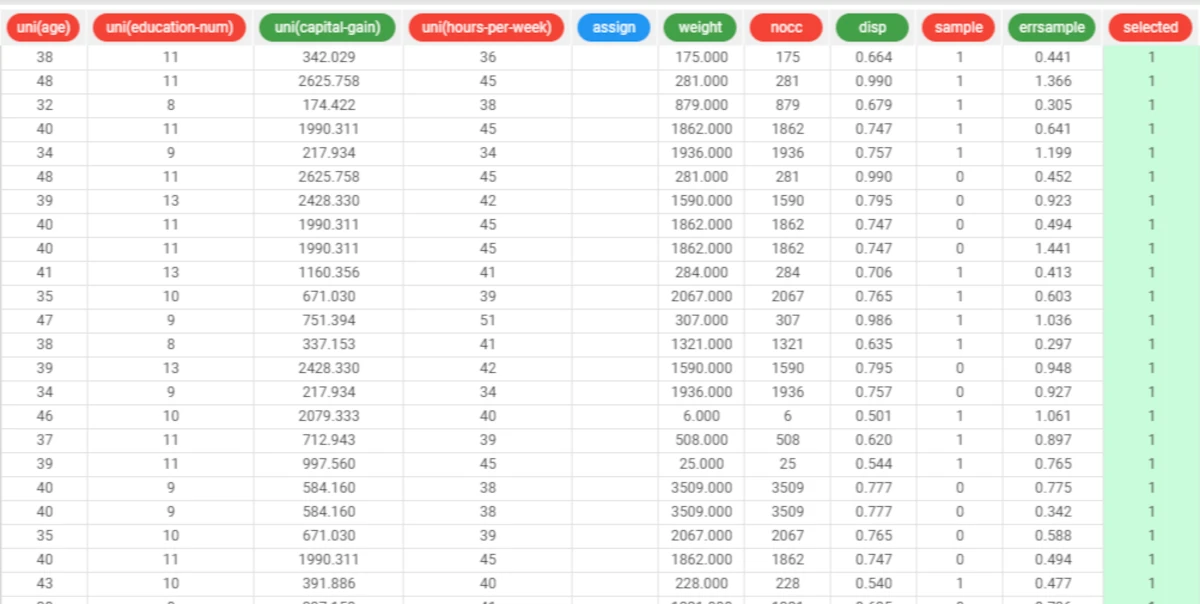
To view information concerning the representative records created by the Projection Clustering (K-means) task, right-click on it, then select Take a look.
For each sample (row) of the training set we have the following result variables (columns)
assign: the initial assignment required by the user for the corresponding representative record; if no variables with role cluster id is included in the original dataset or its assignment is ambiguous (different cluster number for patterns with the same tag), the value in this column is set to missing.
weight: the weight of the associated representative record, computed as the sum of the weights associated with the patterns of the training set which have that tag.
nocc: the number of patterns in the training set which have the same tag as the considered sample (row).
disp: the dispersion coefficient obtained when computing the values of the profile attributes for the representative record.
sample: since several patterns may exist, which have the same tag as the current sample, the first occurrence of that tag in the training set is marked by setting the value 1 in the column; all the other occurrences assume the value 0 for this attribute.
selected: samples passing the data filtering phase assume the value 1 in this column; if no filtering is performed (by clearing the corresponding option in the Projection Clustering (K-means) task) this variable assumes the value 1 in all patterns.
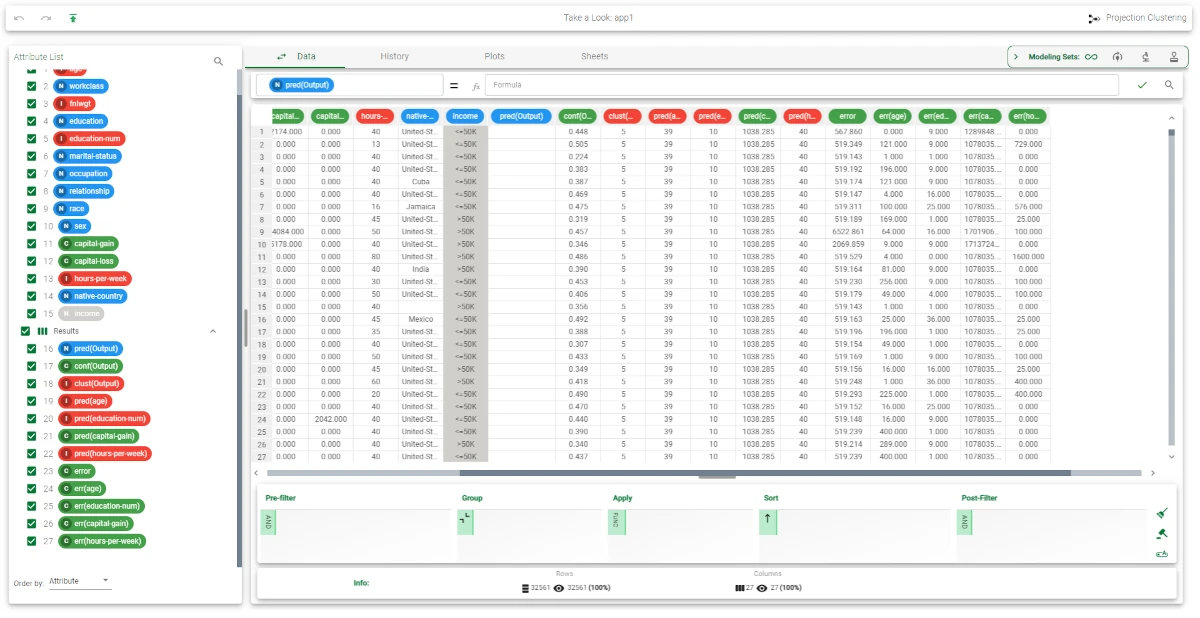
Executing the Apply Model task creates the index of the cluster to which each pattern in the training and in the test set belongs. This is obtained by finding the cluster that includes the same tag as the considered sample; the default cluster is selected if that tag was not considered in the clustering process (i.e. it was not present in the training set).
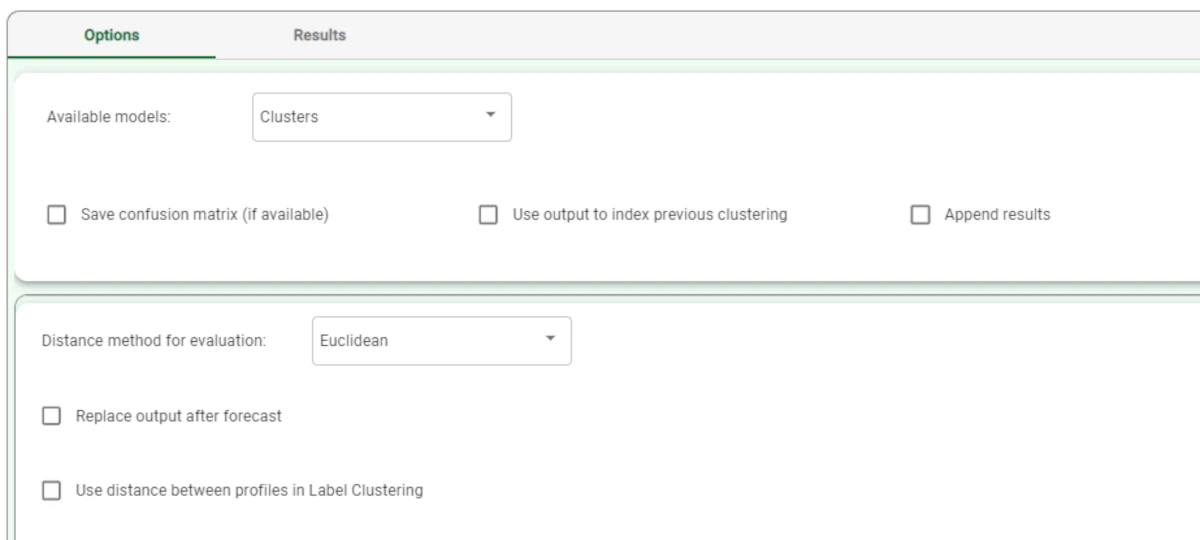
14 additional result attributes have been added to the dataset as can be seen by right-clicking the computed task and selecting Take a look. The first three result attributes concern the cluster associated with the current pattern:
pred(Output): the index of the cluster.
conf(Output): the confidence of the association between cluster and pattern, given by 1-0.5*d1/d2, where d1 and d2 are the distances from the nearest and the second-nearest centroid, respectively. Since d1<d2 the confidence always lies in the interval [0.5,1].
clust(Output): the row of the Clusters tab in the Projection Clustering task containing the associated cluster.
The subsequent five result variables report the values of the profile attributes for the centroid of the associated cluster: pred(age), pred(education-num), etc.
The remaining six result variables concern the error generated when these values are employed as a forecast for the actual profile attributes of the pattern. In particular, the first of these result variables (error) provides the total error, whereas the others (err(age), err(education-name) etc.) provide the error for each attribute.
