The Attributes tab
If you want to perform advanced operations on your features, like modifying their properties in bulk using formulas or queries, you need to use the Attributes tab.
This tab is an alternative spreadsheet-like visualization of your data, limited to dataset features or metadata.
The Attributes tab can be accessed by clicking on the double-arrow symbol next to the Data tab.
Once entered the tab, the main data pane will be filled by a spreadsheet representation of your attributes. The Attribute List in this tab is replaced by a fixed Attribute List containing one entry for each feature property.
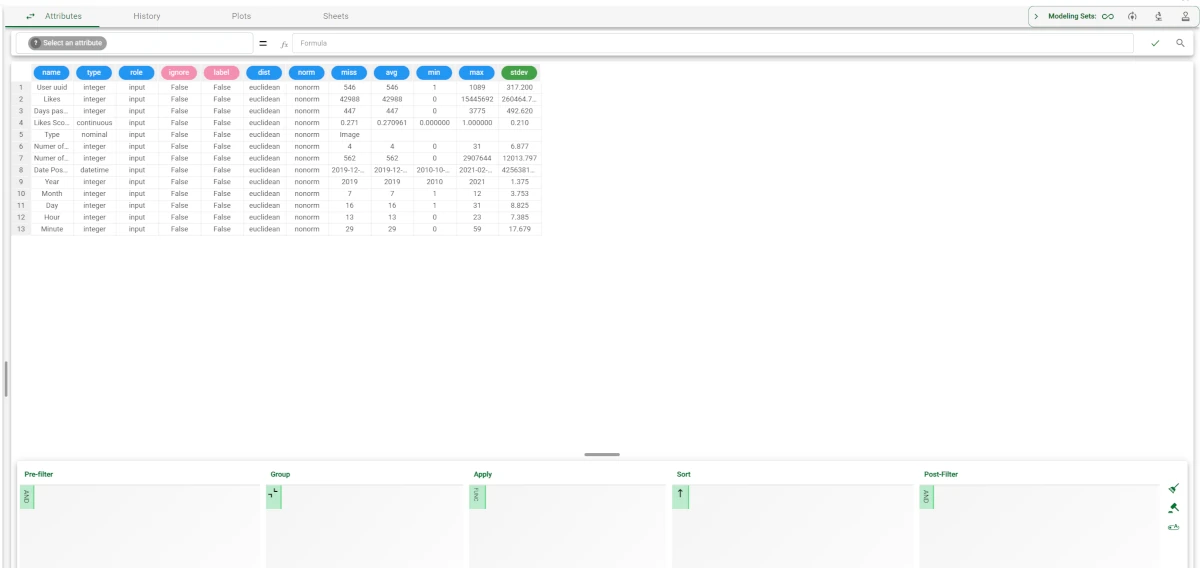
Each row of the spreadsheet in the tab corresponds to an attribute of the Data tab: its details are spread over 12 fixed attributes, containing the names of the various feature properties.:
Name: all attribute names of the dataset are listed.
Type: the corresponding attribute types are listed.
Role: the roles of the corresponding attributes are displayed.
Ignore: a boolean value indicating if the attribute has been ignored.
Label: a boolean value indicating if the attribute has been labelled.
Dist: the chosen method to compute the distance between two patterns with respect to the selected attribute is displayed.
Norm: the chosen method for normalizing the value is displayed.
Miss: the chosen value used as missing for the attribute is displayed.
Avg: the average value used in modeling for the attribute is displayed.
Min: the minimum value used in modeling for the attribute is displayed.
Max: the maximum value used in modeling for the attribute is displayed.
Stdev: standard deviation of the attribute.
Important
Since this visualization is always temporary and the various operations are only effectively performed when the standard Data tab visualization is restored, the Save button is disabled in the Attributes tab of the task toolbar.
Executing bulk operations on attributes
In the Attributes tab, Formula toolbar and Query Manager are still available to filter, sort or execute formulas directly on attributes and not on the actual data of the dataset.
See also
The internal interaction with the Formula toolbar or Query Manager is perfectly aligned with that of the Data tab. For a more detailed description of these two interface elements, please refer to the sections indicated in the links above.
Operations performed in this visualization are applied directly to the columns of the dataset, and not to the rows, as is usually the case in the Data tab.
Danger
When operations performed in the Attributes tab are saved into the Data Manager history two additional operations are added to track the transition steps to Attribute visualization and to Data visualization. Do not move or delete these operations as they may cause erroneous behavior or damage to the dataset, since the internal operations will be performed on the actual dataset and not on the additional metadata spreadsheet.
When working on the Attribute tab, attention must be paid to the following implications:
Adding or removing a row in this visualization mode results in the addition or deletion of features in the original dataset.
Executing a formula allows users to perform a bulk modification of a particular feature property.
Query Make persistent action will delete unfiltered columns.
New columns can be added from the Attribute List, and these can be used as temporary features for complex operations. Please note that any column different from the list of features listed on this page will not be considered during reverse conversion to Data visualization.
Before performing bulk operations on attributes, you need to satisfy the following prerequisites:
Prerequisites
you must select a Flow with a Data Manager task.
having the Data Manager task opened
Procedure
Click on the double arrow icon located on the left of the Data tab header to switch your data visualization to the Dataset attribute presentation.
Drag and drop the new attribute type on the Pre-filter pane.
Select some checkbox entries to filter them out from the underlying dataset.
Write the following formula:
$name = replace($name, "a", "B")in the Formula toolbar, and then click on the green tick icon.Click now on the Clear query icon to empty all the entries in the Query Manager.
Click on the double arrow icon located at the left of the Attributes tab header to switch back to Data visualization.
Check if the names of the attributes considered have been changed by replacing the letter
awith the letterB.