Logic Learning Machine Regression
The Logic Learning Machine Regression task (LLM) solves regression problems. It predicts continuous variables, such as house prices, given a set of input attributes about market conditions, through predictive, intelligible logic-based rules. Prediction is made easier by extracting regression rules from data.
The Logic Learning Machine Regression task is divided into three tabs:
The Options tab, where users can choose the attribute they will work on and with.
The Monitor tab, where users can view the statistics of the generated rules as a histogram series.
The Results tab, where users can visualize the results.
The Options tab
The Options tab is divided into two tabs: the Basic tab and the Advanced tab.
In the Basic tab, users will find the following structure:
The Available attributes, where users will find the dataset’s attributes. It is displayed on both Basic and Advanced tabs.
The Attributes drop area, where users can drag the chosen attributes.
One Customization pane where users are able to customize different options.
Available attributes
Within this section, users will find a list of all the dataset’s attributes. To search for a specific attribute, use the lens icon located at the top right of the panel. Users can also sort the attributes according to their preferences. They can choose from a drop-down list of the Order by option:
Attribute
Name
Type
Ignored
Role
Attributes drop area
The attribute drop area is divided into three panes:
The Input attributes pane, where users can choose the attributes they want to be considered for the classification of data. This operation can be done via a Manual list (users need to manually drag & drop the selected attributes onto the pane) or via a Filtered list.
The Output attributes pane, where users can choose the attributes they want to use to form the final classes into which the dataset will be divided. This operation can be done via a Manual list (users need to manually drag & drop the selected attributes onto the pane) or via a Filtered list.
The Key attributes pane, it contains the attributes that must always be considered in rules, and each rule must always contain a condition for each of the key attributes. This operation can be done via a Manual list (users need to manually drag & drop the selected attributes onto the pane) or via a Filtered list.
Customization Pane
Within this pane, users can set and customize the following options:
Number of rules for each class (0 means ‘automatic’): it defines the number of rules for each class. If set to 0 the minimum number of rules required to cover all patterns in the training set is generated.
Maximum desired dispersion coefficient: if the profile attribute values have a dispersion coefficient (computed with respect to the desired central value) greater than the value entered here, the record shows irregular behavior that may degrade the results of the clustering procedure and will be discarded.
Maximum number of conditions for a rule: it sets the maximum number of condition in a rule.
Maximum nominal values: it defines the maximum number of values in nominal condition.
Maximum error allowed for each rule (%): it defines the maximum error (in percentage) that a rule can score.
Minimum interval for a condition on ordered attribute (%): it defines the minimum interval for a condition on ordered attribute as a percentage of total range.
Consider relative error instead o absolute: if selected, it will consider relative error instead of absolute.
Prevent interval conditions for ordered attributes: if selected, interval conditions, such as 1<x≤5, are avoided, and only conditions with > (greater than) ≤ (lower or equal than) are generated.
In the Advanced tab, users will find the following structure:
Minimize number of conditions: if selected, rules with fewer conditions, but the same covering, are privileged.
Ignore attributes not present in rules: if selected, attributes that have not been included in rules will be flagged Ignore at the end of the training process, to reflect their redundancy in the classification problem at hand.
Hold all the generated rules: if selected, any redundant generated rules - verified by training samples covered by more powerful rules - will be kept.
Aggregate data before processing: if selected, identical patterns are aggregated and considered as a single pattern during the training phase.
Missing values verify any rule condition: if selected, missing values will be assumed to satisfy any condition
Perform a coarse-grained training (faster): if selected, the LLM training algorithm considers the conditions with the subset of values that maximizes covering for each input attribute.
Use median as output value: if selected, the median is used instead of the average when computing the output of each rule.
Append results: if selected, the results of this computation are appended to the dataset, otherwise they replace the results of previous computations.
Maximum number of trials in bottom-up mode: the number of times a bottom-up procedure can be repeated, after which a top-down procedure will be adopted.
Initialize random generator with seed: if selected, a seed, which defines the starting point in the sequence, is used during random generation operations. Consequently, using the same seed each time will make each execution reproducible.
Overlap between rules (%): the weight to be given to covered patterns compared to not covered patterns when building rules.
Key usage mode: users can select one or more attributes as keys. Possible values are:
Partial: if selected, it only evaluates the portion of the dataset containing the selected key values.
Complete: if selected, the software evaluates all possible combinations of key values to assess the results conditions on the entire training set.
Minimal: if selected, this only ensures that all the generated rules include at least one condition on key attributes.
The Monitor tab
Both during and after computation, this tab allows users to view the statistics of the generated rules as a series of histograms.
The Monitor tab is divided into three tabs:
the Conditions tab
the Covering tab
the Error tab
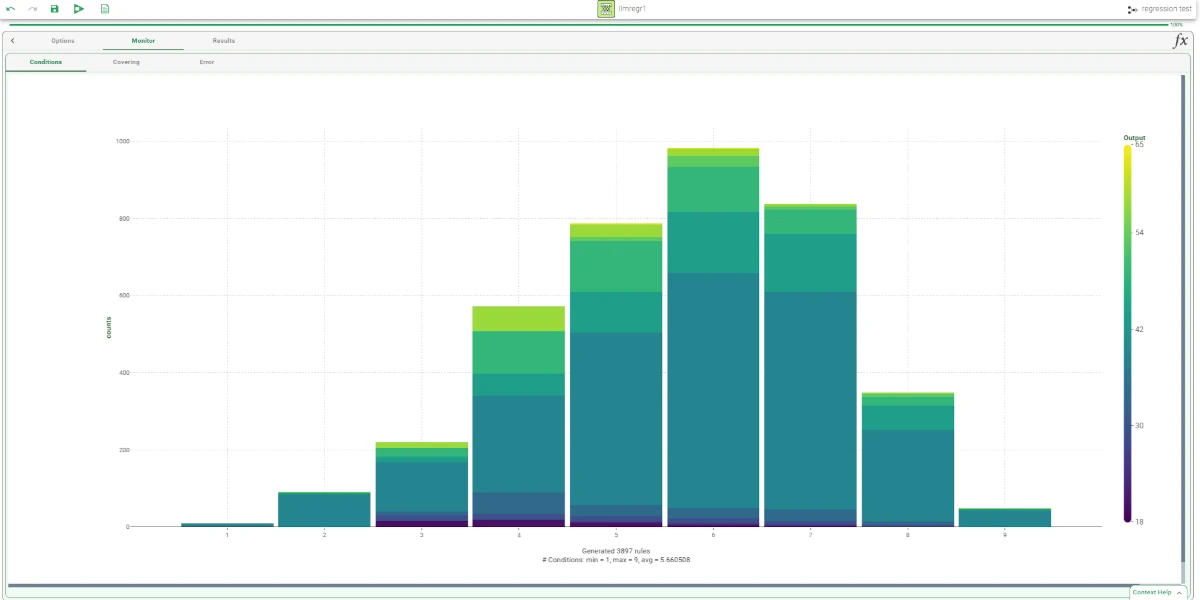
Conditions tab
This tab contains a bar plot displaying the following information:
On the X axis: users will see the number of conditions generated
On the Y axis: users will see the counts of the rules containing specific number of conditions.
Covering tab
This tab contains a bar plot displaying the following information:
On the X axis: users will see the covering percentage.
On the Y axis: users will see the counts of the rules with the corresponding percentage of covering.
Error tab
This tab contains a bar plot displaying the following information:
On the X axis: users will see the error percentage.
On the Y axis: users will see the counts of the rules with the corresponding percentage of error.
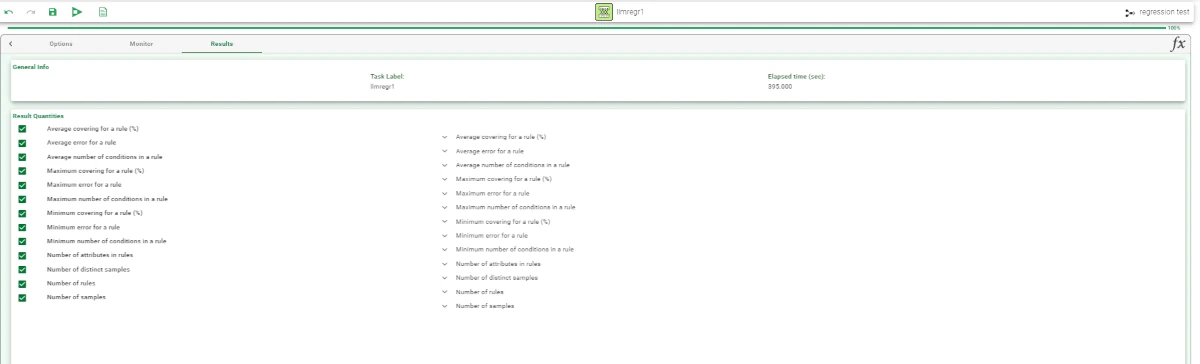
The Results tab
Within this tab, users can visualize a summary of the computation.
This tab is divided into two panes:
General Info
Within this pane, users can find the following information:
Task Label
Elapsed time (sec)
Result Quantities
Within this pane, users can set and configure the following options:
Average covering for a rule (%)
Average error for a rule
Average number of conditions in a rule
Maximum covering for a rule (%)
Maximum error for a rule
Maximum number of conditions in a rule
Maximum covering for a rule (%)
Minimum error for a rule
Minimum number of conditions in a rule
Number of attributes in rules
Number of distinct samples
Number of rules
Number of samples
These checkboxes are checked by default.
On the right of the Number of samples checkbox, users, through a drop-down list, will be able to visualize the following options:
Train
Test
Valid
Whole
Example
The following example uses the Adult dataset.
After having imported the dataset with the Import from Text File task, split the dataset into test and training sets (30% test and 70% training) with the Split Data task.
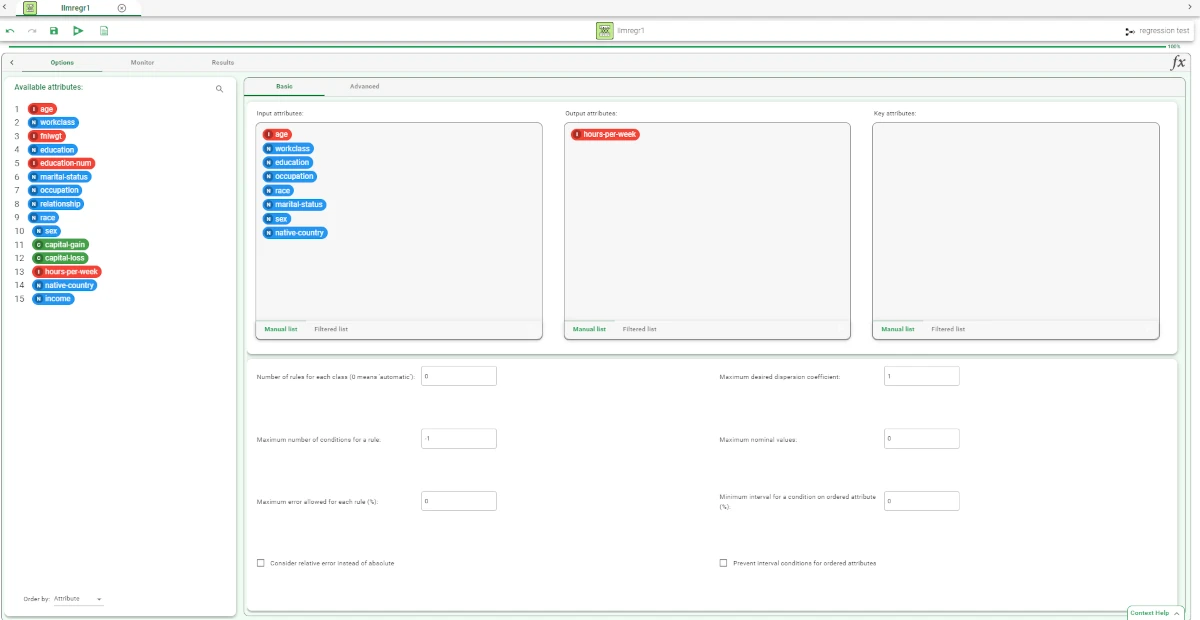
Add a Logic Learning Machine Regression task. Specify the following attributes:
Output attributes: hours-per-week
Input attributes: age, workclass, education, occupation, race, marital-status, sex, native-country.
Save and compute the task.
The properties of the generated rules can be viewed in the Monitor tab of the Logic Learning Machine Regression task. It displays a plot with:
Conditions tab: the counts of the conditions.
Covering tab: the counts of the covering.
Error tab: the counts of the errors.
Click on the Results tab to display:
the execution time
some input data properties, such as the number of patterns and attributes
some results of the computation, such as number of rules and rule statistics, etc.
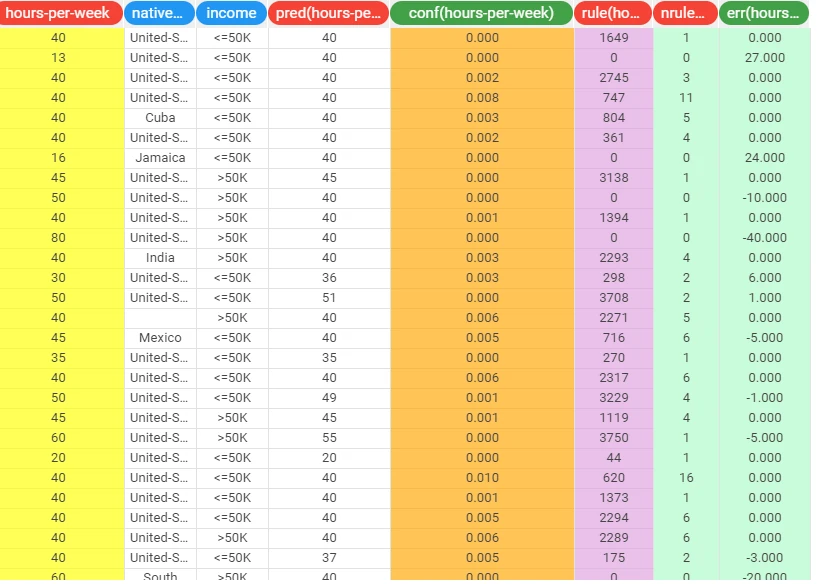
Add an Apply Model task to the Logic Learning Machine Regression task to apply the model. The forecast produced can be analyzed by right-clicking the Apply Model task and selecting Take a look.
The following columns have been added to the data set:
the forecast for each pattern: pred(hours-per-week)
the confidence relative to this forecast conf(hours-per-week)
the most important rule that determined the prediction: rule(hours-per-week)
the forecast error, i.e. 1 in case of misclassification and 0 in case of correct forecast: err(hours-per-week)