Standard Clustering
The Standard Clustering task clusters data with a k-means algorithm, by dividing a given dataset into k clusters and aggregating representative records with similar profiles.
The statistical average of all the data items in the same cluster is defined as the cluster centroid.
This task is divided into four tabs:
The Options Tab
The Monitor Tab
The Clusters Tab
The Results Tab
The Options tab
In the Options tab, users can set up the analysis’ constraints. It is divided into two tabs: the Basic and the Advanced tab.
More information on this tab can be found in the clustering tasks homepage.
The Monitor tab
In the Monitor tab, users can visualize the properties of the generated clusters. It is divided into two tabs: the Elements and the Dispersion tabs.
More information on this tab can be found in the clustering tasks homepage.
The Clusters tab
The Clusters tab contains a spreadsheet displaying the values of the profile attributes for the centroids of the generated clusters, along with the number of elements and the dispersion coefficient for each of them.
More information on this tab can be found in the clustering tasks homepage.
The Results tab
The Results tab provides information on the computation. It is divided into two sections:
General info, whose features are described in the clustering tasks homepage
Result Quantities, where users can visualize the following results quantities:
Average dispersion of clusters
Average weight
Davies-Bouldin index
Dispersion of default cluster
Inter-cluster distance variance
Intra-cluster distance variance
Maximum number of points in a cluster
Minimum number of points in a cluster
Number of clusters
Number of samples
Number of singleton clusters
PseudoF index (Calinski-Harabasz criterion)
Relative PseudoF index
Example
This example uses the Adult dataset.
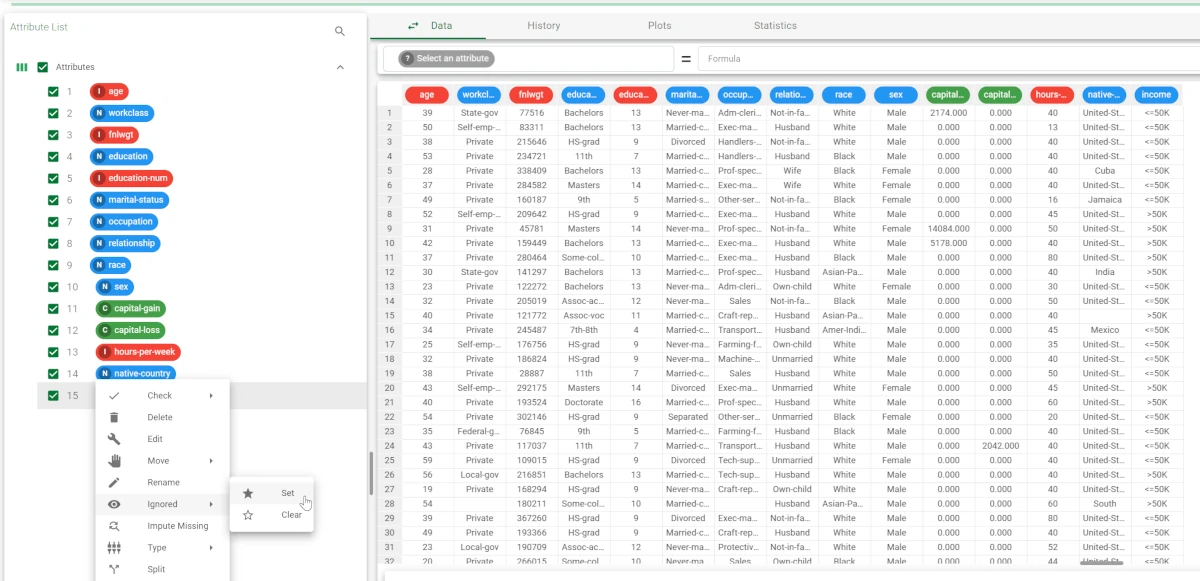
After having imported the dataset through an Import from Text File task, drag a Data Manager onto the stage, and link it to the import task.
Open the Data Manager and right-click on the Income attribute, then select Ignored>Set.
Save and compute the task.
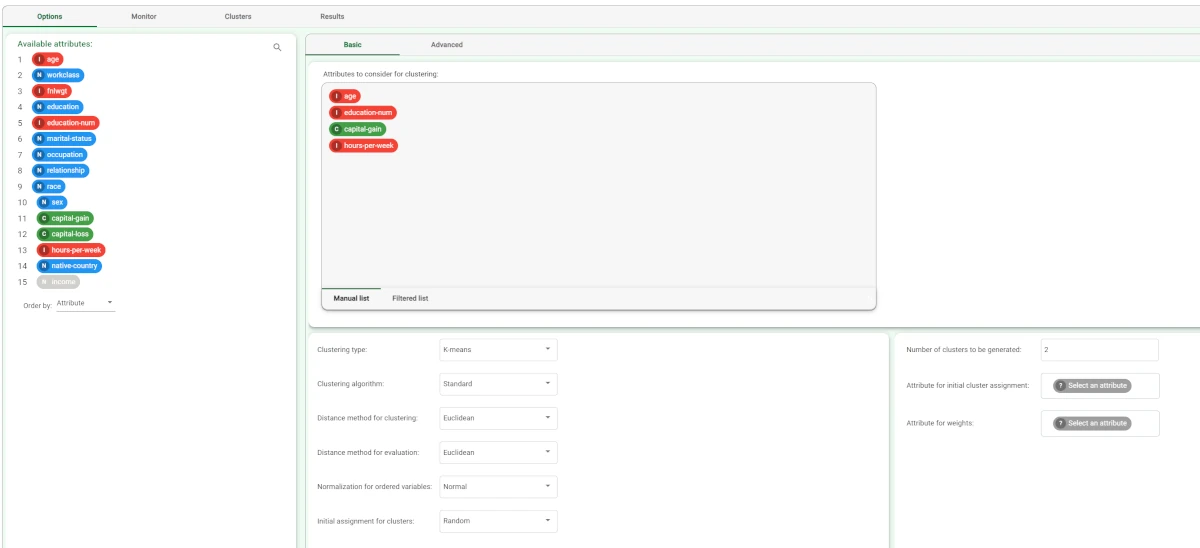
Add a Standard Clustering (K-means) task to the flow and configure it as follows:
Drag the age, education-num, capital-gain and hours-per-week attributes onto the Attributes to consider for clustering list.
Select Normal in the Normalization for ordered variables drop-down list.
Enter 2 in the Number of clusters to be generated (the number of classes in the original classification problem) box.
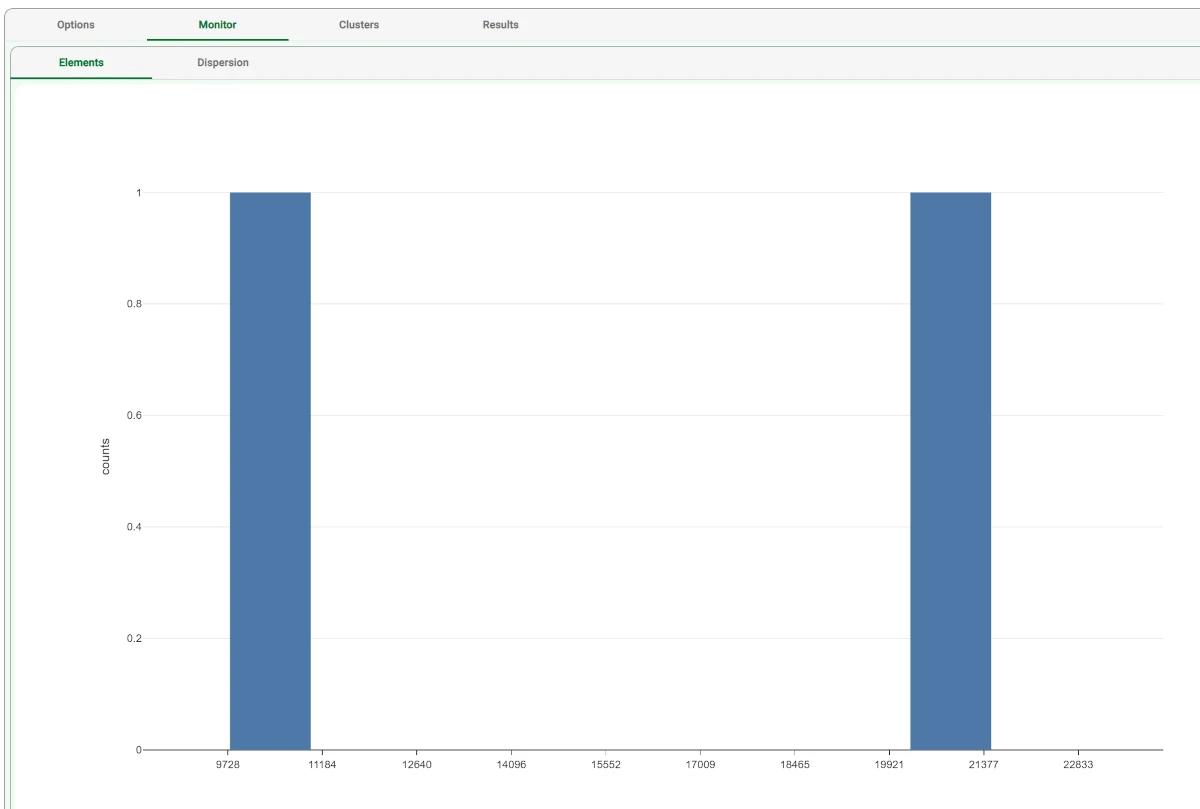
After clicking Compute to start the analysis, the properties of the generated clusters can be viewed in the Monitor tab of the Standard Clustering task.
At the end of the computation the dispersion coefficients of the clusters are displayed. A similar histogram can be viewed for the number of elements, by opening the corresponding #Elements tab, as shown in the screenshot.
Note that you can stop the computation at any point by clicking the Stop computation button in the main toolbar. In this case, the last cluster subdivision is maintained and considered hereinafter.
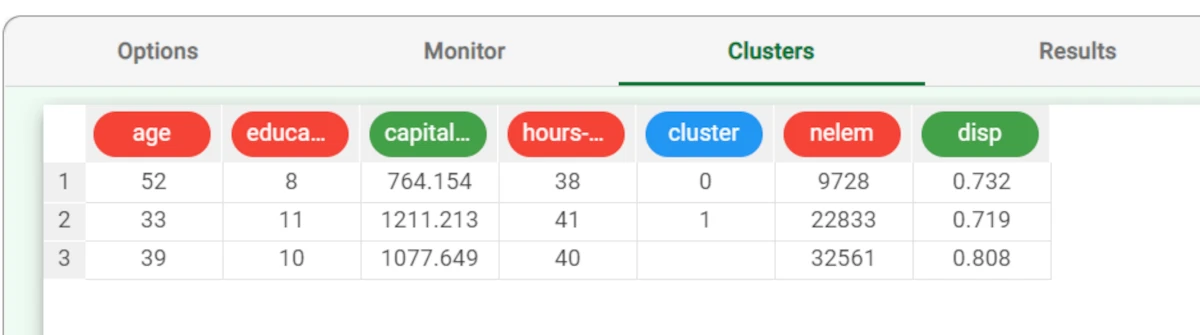
After the execution we obtain two clusters whose characteristics are displayed in the Clusters panel of the task. In each row of the spreadsheet the first columns contain the centroids for the clusters. The cluster column contains the progressive index of the cluster, whereas the columns nelem and disp give the number of elements and the dispersion coefficient, respectively. The last (third) row reports the values characterizing the default cluster, obtained by including in a single group all the elements of the training set.
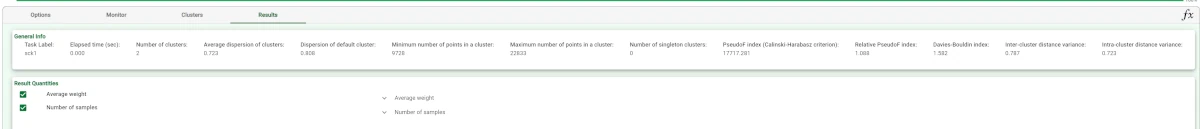
Clicking on the Results tab displays a summary of the computation performed, with:
the task name and identifier and execution time,
some input data quantities,
some results of the computation, such as the number of clusters generated and their properties.
Add an Apply Model task to the flow to create the index of the cluster to which each pattern in the training and in the test set belongs. This is obtained by finding the nearest centroid according to the Distance and Normalization options selected in the Option panel of the Standard Clustering task.
Compute the task leaving its default settings. To view the results, right-click the Apply Model task and select Take a look.
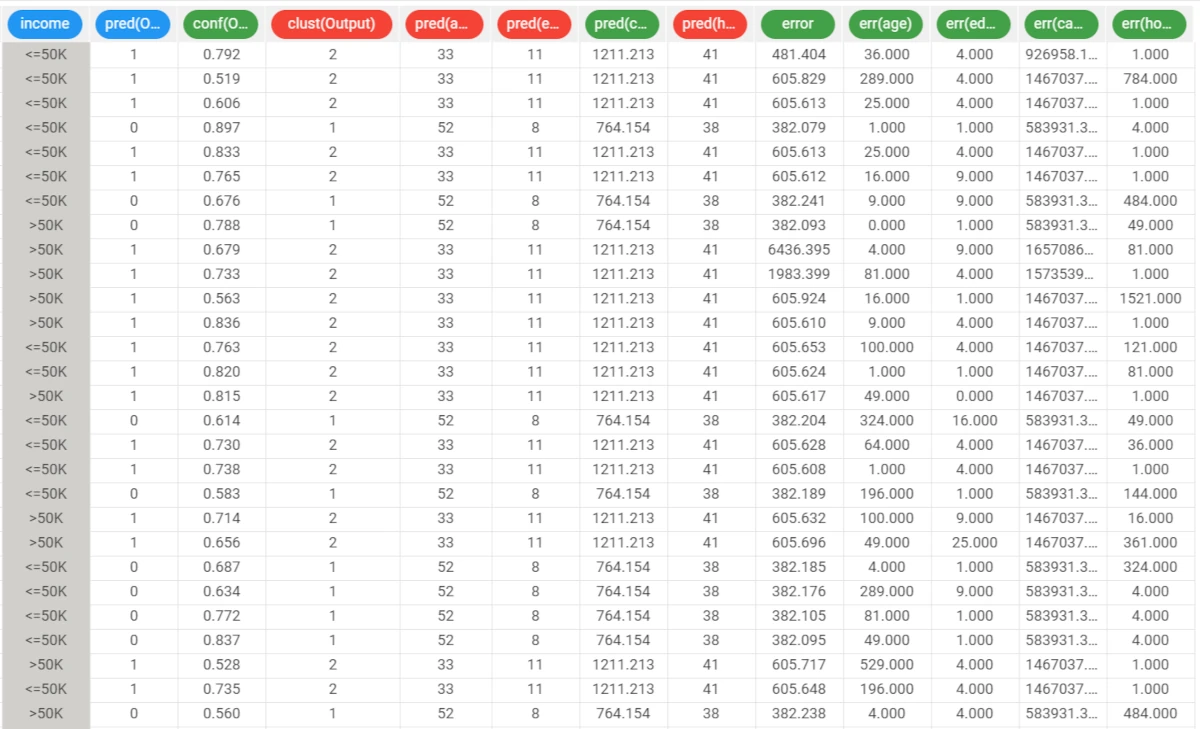
32 additional result variables have been added to the dataset as can be seen in the final Data Manager task.
The first three result variables concern the cluster associated with the current pattern:
The index of the cluster: pred(Output).
The confidence of the association between cluster and pattern: conf(Output), given by 1-0.5*d1/d2, where d1 and d2 are the distances from the nearest and the second-nearest centroid, respectively. Since d1<d2 the confidence always lies in the interval [0.5,1].
The row of the Clusters tab in the Standard Clustering task containing the associated cluster: clust(Output).
The subsequent 14 result variables report the values of the profile attributes for the centroid of the associated cluster: pred(age), pred(workclass), etc.
The remaining 15 result variables concern the error performed when these values are employed as a forecast for the actual profile attributes of the pattern. In particular, the first of these result variables (error) provides the total error, whereas the others (err(age), err(workclass), etc.) give the error for each attribute.