Anomaly Detection
The Anomaly Detection task extracts and characterizes anomalies from an event log, singling out the events in the flow which do not fit with any of the frequent sequences in the process model.
To perform this operation the task must receive an event log and the frequent sequences generated by the Sequence Analysis task. The task then provides a list of anomalies in output.
The task is made of three tabs:
the Options tab, where you can configure the analysis features.
the Compressed frequent sequences, where you can visualize a spreadsheet with the results of the analysis for each sequence.
the Results tab, where results on the computation are shown.
Warning
You must have generated sequences with the Sequence Analysis task.
The Options tab
The Options tab contains all the options that can be customized to obtain the desired output.
It is divided into two tabs: the Basic and the Compression tabs.
The Available attributes list, located at the left of the screen, is always displayed, no matter which Options tab is opened.
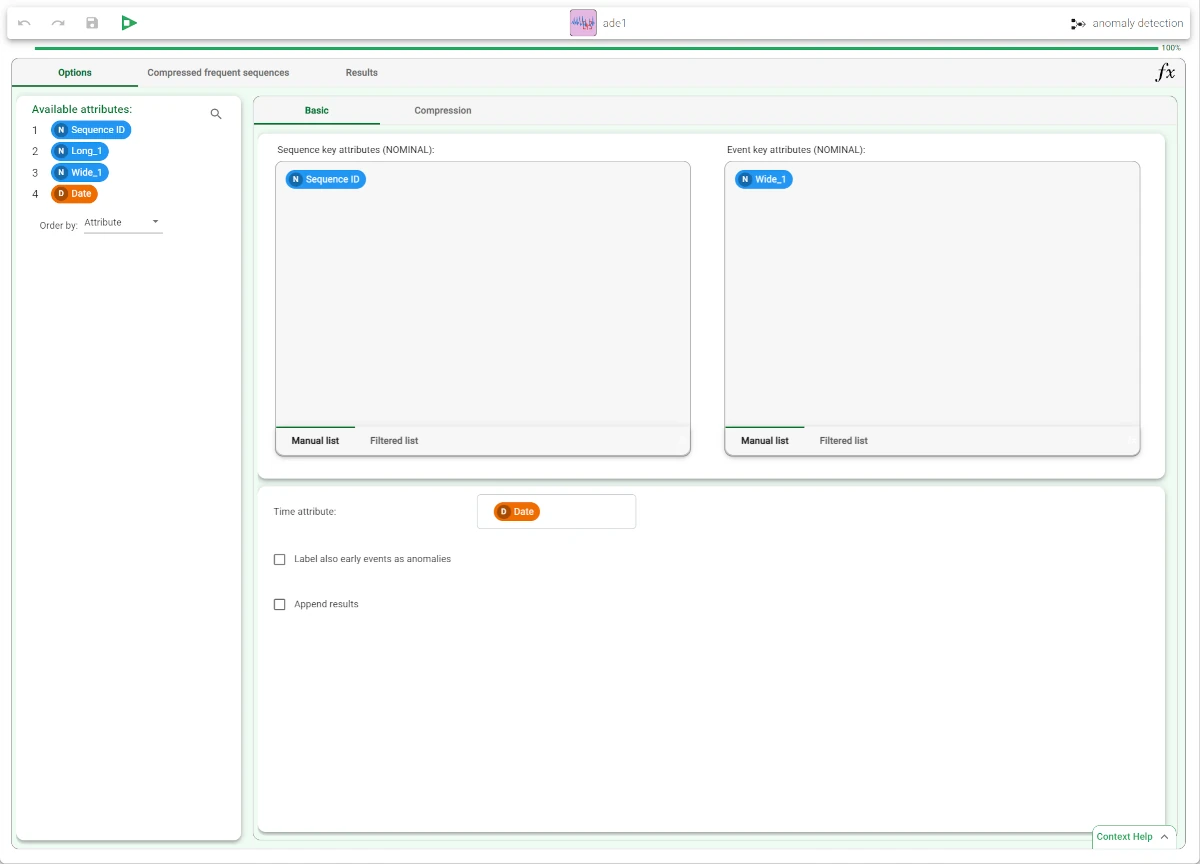
Basic tab
The Basic tab is divided into two areas, distinguished from the Available attributes list on the left of the screen:
- the attribute drop area, where you can drag the attributes required to perform the analysis onto two boxes:
the Sequence key attributes (NOMINAL) area: the nominal attributes which will be used to identify sequences from the Available Attributes list to this list. Instead of manually dragging and dropping attributes, they can be defined via a filtered list.
the Event key attributes (NOMINAL) area: the nominal attributes which will be used to characterize events from the Available Attributes list to this list. Instead of manually dragging and dropping attributes, they can be defined via a filtered list.
- the configuration section contains the following options:
Time attribute: select the attribute that contains the timestamp for events.
Label also early events as anomalies: if selected, early events are labeled as anomalies. This may happen when one event is detected shortly after the event preceding it in the sequence, earlier than the minimum time span between those events predicted by the model.
Append results: if selected, attributes generated by the tasks will follow current result attributes, otherwise current result attributes will be overwritten.
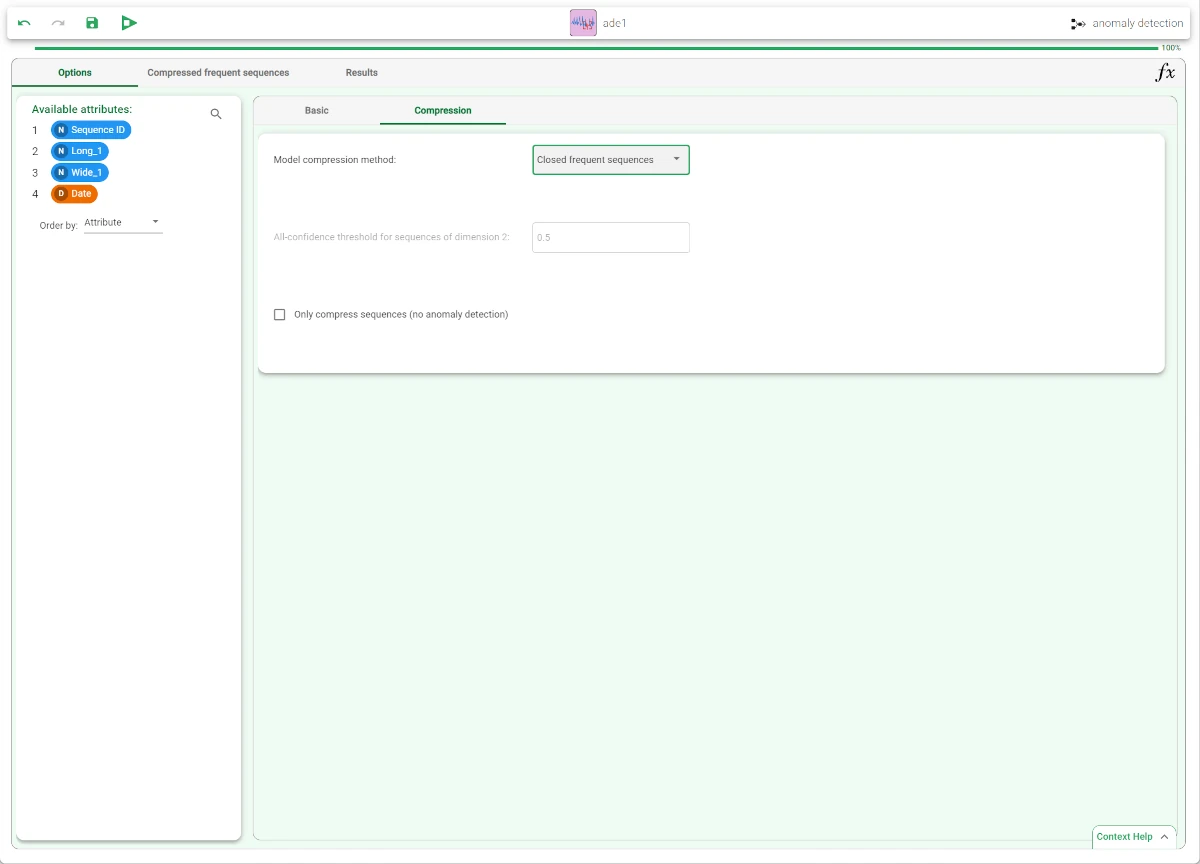
Compression tab
The Compression tab contains the following options, distinguished from the Available attributes list on the left of the screen:
- Model Compression method: select how you want to compress the frequent sequences model to single out anomalies from the drop-down list. Possible values are:
Maximal frequent sequences: to consider only frequent sequences which are not sub-sequences of any other frequent sequence.
Closed frequent sequences: to discard frequent sequences for which at least one supersequence has the same support
All-confidence based filter: to discard frequent sequences for which at least one supersequence meets the minimum all-confidence threshold defined below. The minimum threshold is fixed by the user for sequences of cardinality 2 (couple of events) and decreases linearly with cardinality.
All-confidence threshold for sequences of dimension 2: if the All-confidence based filter has been selected as the compression method above, select the value which determines if a sequence should be discarded or not.
Only compress sequences (no anomaly detection): if selected, sequences will be compressed, but no anomaly detection will be performed.
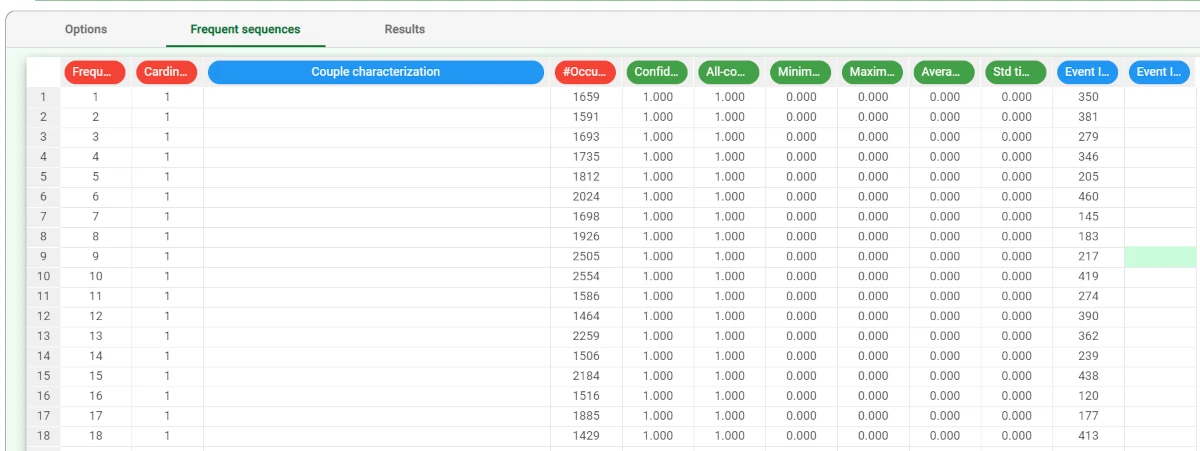
The Compressed frequent sequences tab
In this tab, the details about the frequent sequences analysis are provided in a spreadsheet format.
The spreadsheet is made of the following attributes:
Frequent Sequence ID: the sequential number of the frequent sequence.
Cardinality: the number of events constituting the frequent sequence.
- Couple characterization: a qualitative characterization of the behavior for the sequence of two events A-B. The possible outcomes are:
Weak sequence: B is likely to follow A, A is indifferent to B.
Strong sequence: B is likely to follow A, A is unlikely to follow B.
Complements: B is likely to follow A and vice versa.
Substitutes: B is unlikely to follow A and vice versa.
Independents: B is indifferent to A and vice versa.
Not enough information to determine
#Occurrences: the number of times in which the sequence is retrieved in the data.
Confidences: the ration of cases (0-1 value) in which, if the initial part of the sequence is verified, the final part follows. The first column of confidence is referred to the initial event, i.e. measures how often, if the initial event happens, the rest of the sequence follows. If a Maximum sequence cardinality higher than 2 is set, other columns are also generated, representing how often if the first two events are verified the other follows and so on.
All-Confidence: the ratio between the number of occurrences of the whole sequence and the number of occurrences of the least frequent event included in the sequence.
Minimum time interval: the minimum interval of occurrences associated to the frequent sequence.
Maximum time interval: the maximum interval of occurrences associated to the frequent sequence.
Average time interval: the average interval of occurrences associated to the frequent sequence.
Std time interval: the standard interval of occurrences associated to the frequent sequence.
Event ID #: the IDs of the events that make up the frequent sequence.
The Results tab
The Results tab contains information about the computation. It is divided into two sections:
- The General Info section, where the following information can be found:
The Task Label, which is the task’s name on the interface.
The Elapsed time, which indicates how long it took to complete the computation.
The Number of different events in input, indicating the number of events that make up the sequence.
The Number of different sequences in input, indicating the number of the sequences considered as an input in the analysis.
The Number of detected anomalies, which indicates the number of the anomalies detected.
The Number of compressed frequent sequences, indicating the number of frequent sequences compressed during the computation.
- The Result Quantities section contains the data quantities: check the results to be visualized, then open them by clicking on the arrow button to visualize the quantities’ values. The following information is provided:
Number of compressed frequent sequences: the number of frequent sequences which constitute the model, after the compression step performed by the task.
Number of detected anomalies: the number of events labeled as anomalies by the task.
Number of different events in input: the number of distinct events which were fed to the task during the latest computation.
Number of different sequences in input: the number of distinct sequences which were fed to the task during the latest computation.
All the quantities listed above are divided in Events, Sequences, Anomalies, Comp.
Example
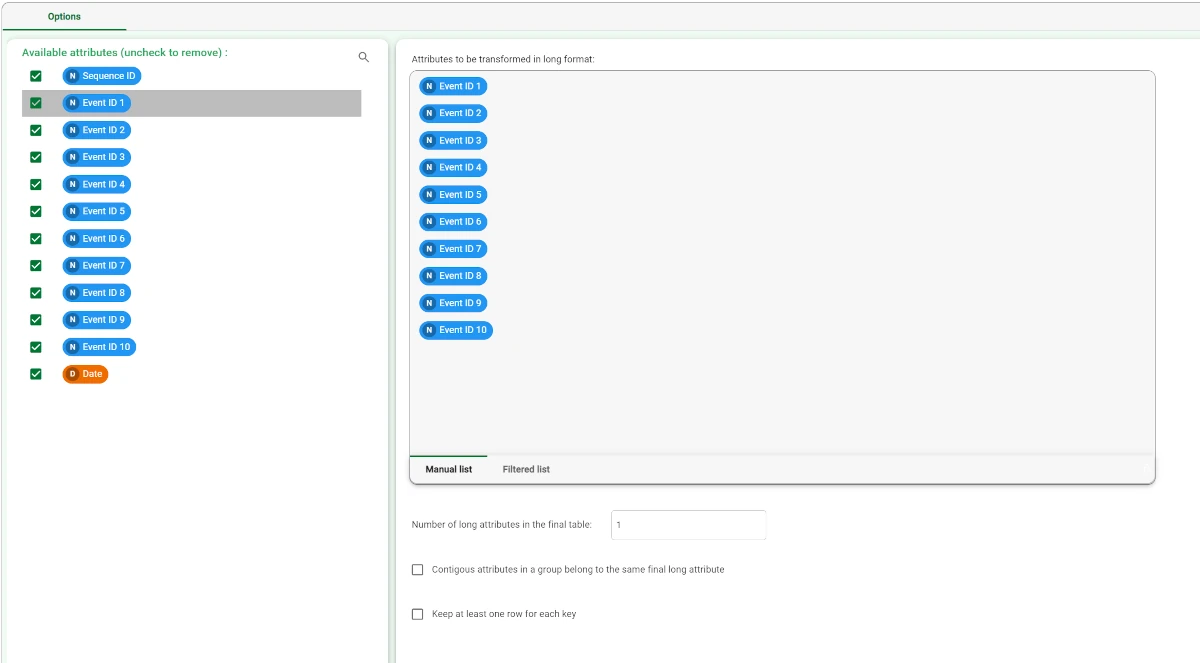
After having imported the san-test dataset, add a Reshape to Long task, as each row of the dataset represents a sequence, composed by Sequence ID, the date of occurrence, and a variable number of Event IDs.
Configure the Reshape to Long task as follows:
- Attributes to be transformed to long format:
Event ID 1
Event ID 2
Event ID 3
Event ID 4
Event ID 5
Event ID 6
Event ID 7
Event ID 8
Event ID 9
Event ID 10
Leave the other options as default and save and compute the task.
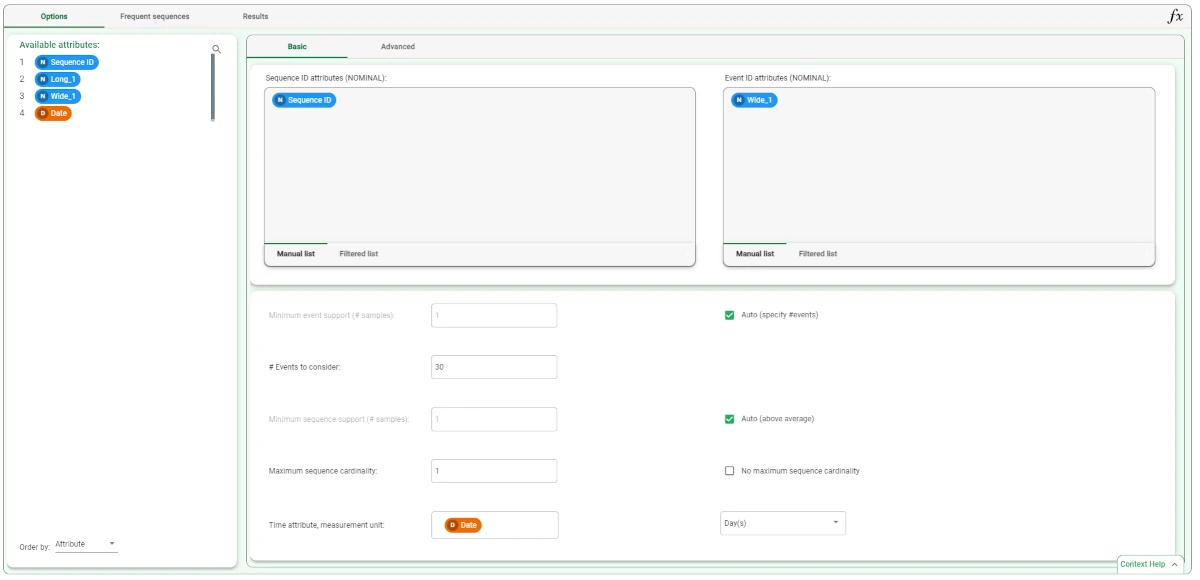
Then, we connect the Sequence Analysis task to the Reshape to Long task.
- Configure the task as follows:
Drag and drop the Sequence ID attribute in the Sequence ID attributes list and the Wide_1 attribute in the Event ID attributes list.
Select the Auto option for the Minimum event support.
Set the #Events to consider to 30 (if you have problems setting this number deselect and reselect the Auto option above).
Deselect the Auto (above average) option for Minimum sequence support (#samples) and set the value to 10.
Set the Maximum sequence cardinality to 2.
Select Date as the Time attribute (and Day as the unit of measure).
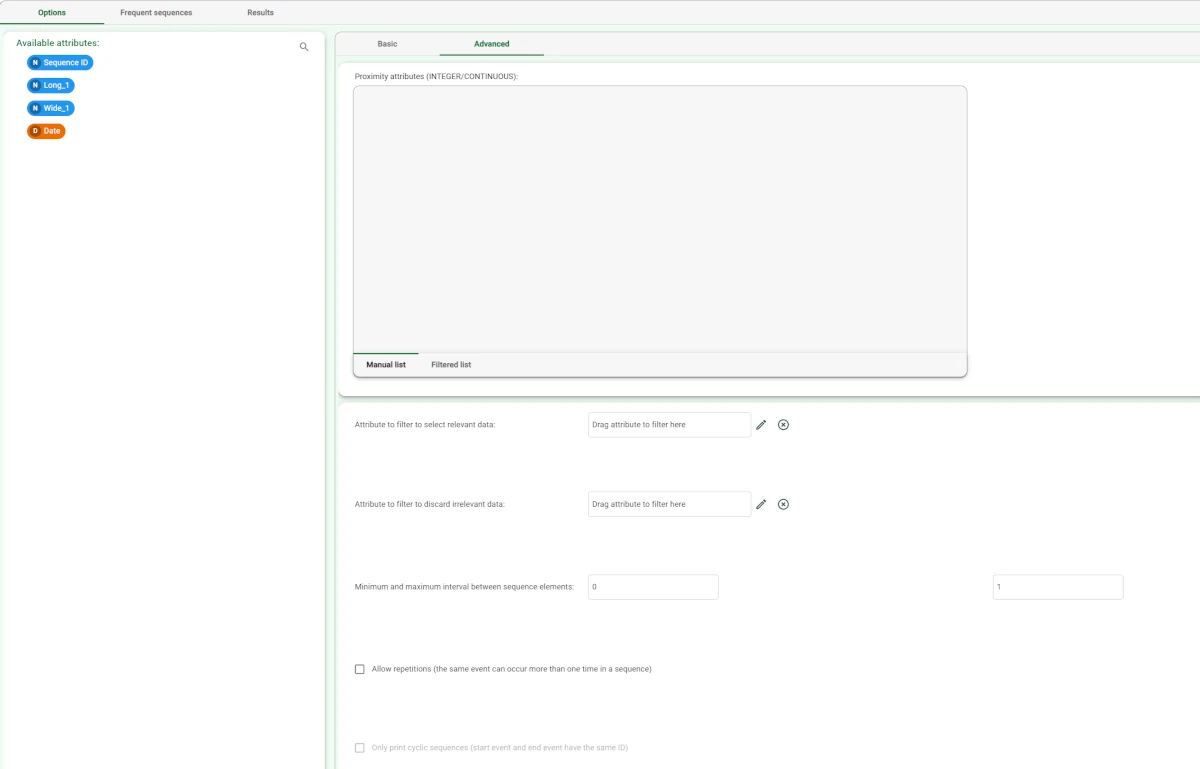
Set the Minimum and maximum interval between sequence elements respectively to 0 and 1.
Save and compute the task. The extracted frequent sequences can be seen in the Frequent Sequences tab.
- Now we connect the Anomaly Detection task to the Sequence Analysis task, and configure it as follows:
Drag and drop the Sequence ID attribute in the Sequence key attributes list and the Wide_1 attribute in the Event key attributes list.
Select Date as the Time attribute.
In the Compression tab of the Options panel, select Closed frequent sequences as Model compression method.
Save and compute the task.
To check the results of the computation, right-click the task in the process and select Take a look. Alternatively, you can link a Data Manager to the task.
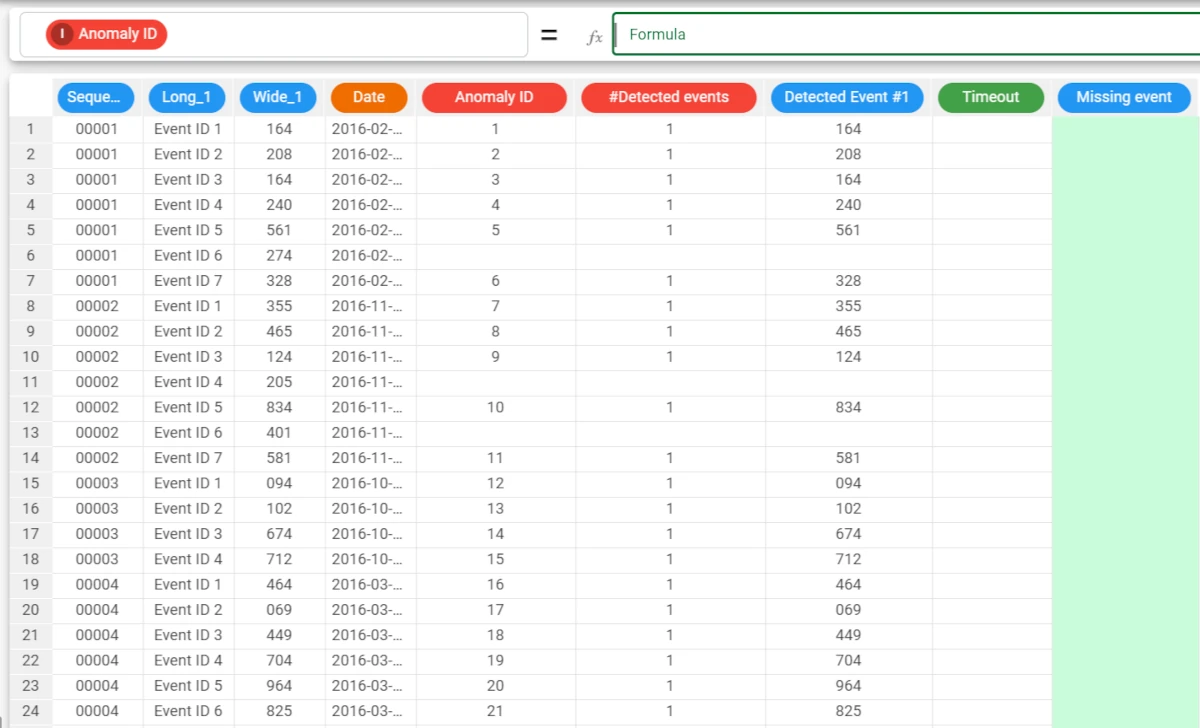
Supplementary attributes, generated by the Anomaly Detection task, have been generated, allowing us to determine if, with respect to the considered model, the event is an anomaly. For each anomalous event, if previous events constituting an incomplete frequent sequence involving it were detected, their IDs are printed in the Detected Event column(s) and the one which should be next is included in the Missing Event column. The timeout period after which the missing event was not detected is stored in the Timeout column. Otherwise, if the event is anomalous by itself, i.e. if it is not frequent enough to be included in the (compressed) frequent sequences model, the Detected event column is filled with the ID of the event itself, and both the Timeout and the Missing Event columns are left blank.