Standard Clustering
Rulex Factory has created a task aimed at making easier for users to work with and within their data: the Standard Clustering (k-means) task. This is a powerful way of organizing data into logical groups of similar patterns, making it easier to understand. Rulex clusters data with k-means algorithms and divides a given task into k clusters; for more detailed information, please refer to the Clustering Overview page.
The Standard Clustering (k-means) task is divided into four tabs:
The Options Tab, where users can choose the attribute they will work on and with.
The Monitor Tab, where users can view the properties of the new clusters.
The Clusters Tab, where users can visualize the group created.
The Results Tab, where users can visualize the results.
The Options tab
The Options tab is divided into two tabs: the Basic tab and the Advanced tab.
In the Basic tab, users will find the following structure:
The Available attributes, where users will find the dataset’s attributes.
The Attributes drop area, where users can drag the chosen attributes.
Two Customization panes, where users are able to customize different options.
Available Attributes
Within this section, users will find a list of all the dataset’s attributes. To search for a specific attribute, use the lens icon at the top right of the panel. Users also have the option of sorting the attributes according to their preferences. They can choose from a drop-down list of the Order by option:
Attribute
Name
Type
Ignored
Role
Attributes Drop Area
The Attribute drop area contains the following options:
The Attributes to consider for clustering pane, where need to insert the attributes they want to use as input for creating their cluster computation. This operation can be done via a Manual List (users need to manually Drag & Drop the selected attributes onto the pane) or via a filtered list.
Customization Panes
Within these two customization panes, users can set the following options:
Clustering type. From the drop-down list, users can choose between:
K-means: the mean is used to compute the cluster centroid.
K- medians: the median is used to compute the cluster centroid.
K- medoids: the point of the dataset closest to the mean is used as the cluster centroid.
Clustering algorithm. From the drop-down list, users can choose between:
Standard
Incremental
Error-based
Distance method for clustering. From the drop-down list, users can choose between:
Euclidean
Euclidean normalized
Manhattan
Manhattan (normalized)
Person
Normalization for ordered variables. From the drop-down list, users can choose between:
None
Attribute
Normal
Minmax [0.1]
Minmax [-1,1]
Initial assignment for cluster. From the drop-down list, users can choose the procedure adopted for initial assignment of points to clusters:
Random
Smart
Weight based
Number of clusters to be generated. Users can choose the required number of clusters. The number of clusters can’t exceed the number of different examples in the training set.
Attribute for initial cluster assignment. Users can choose a specific attribute from the list, which will be used as initial cluster assignment.
Attribute for weights. Users can choose a specific attribute from the list, which will be used a weight in the clustering process.
In the Advanced tab, users will find the several advanced customization options. For more information, refer to the introductory Clustering tasks page.
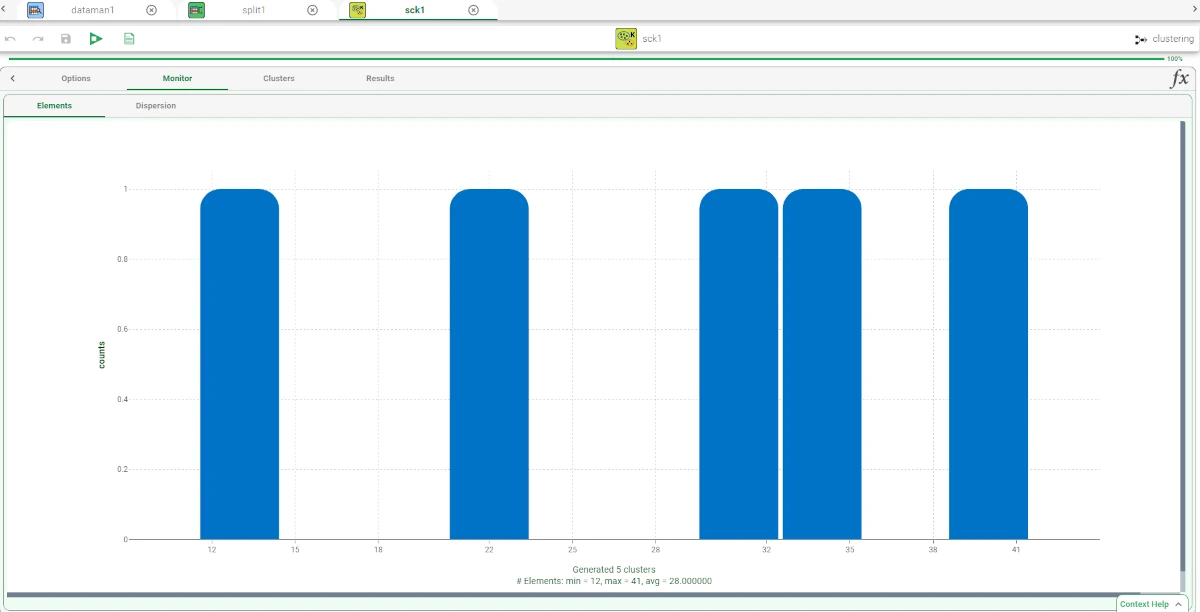
The Monitor tab
In the Monitor tab, users can visualize the properties of the generated clusters. It is divided into two tabs: the Elements and the Dispersion tabs.
Elements
In the Elements tab, users can view a histogram displaying the number of elements.
On the X axis, users can visualize the Range.
On the Y axis, users will visualize the counts.
Information such as Count, Range, Percentage on tot, and Percentage on bat will be displayed by hoovering on one bar displayed in the tab.
Dispersion
This tab allows users to see how distinct data points are in every cluster. A high dispersion implies lower uniformity in the cluster. An optimal cluster should have many elements and a low dispersion coefficient, indicating that the data points in the group share similar features.
On the X axis, users can visualize the Range.
On the Y axis, users will visualize the counts.
Information such as Count, Range, Percentage on tot, and Percentage on bat will be displayed by hovering on one bar displayed in the tab.
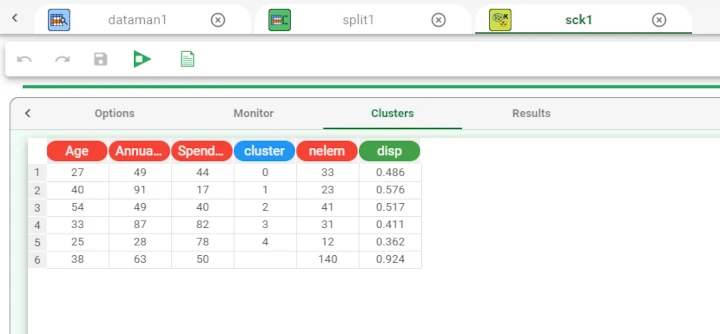
The Clusters tab
Within this tab, users can visualize the groups created before. This tab contains a spreadsheet showing:
the values of the profile attributes for the centroids of created clusters
the number of elements
the dispersion coefficient
Note
The column cluster: contain the index of the cluster (centroids)
The column nelem: contains the number of elements within a cluster
The column disp: contains the dispersion coefficient
The Results tab
In the Results tab, users can visualize a summary of the results. This tab is divided into two panes:
General Info
Within this pane, users can find the following information:
Task label
Elapsed time (sec)
Number of clusters
Average dispersion of clusters
Dispersion of default clusters
Minimum umber of points in a cluster
Maximum number of points in a cluster
Number of singleton clusters
Davies-Bouldin index
Inter-cluster distance variance
Intra-cluster distance variance
Result Quantities
Within this pane, users can set and configure the following options:
Average weight
Number of samples
The two checkboxes are checked by default.
On the right of the above-mentioned checboxes, users, through a drop-down list, will be able to choose between the following options:
Train
Test
Valid
Whole
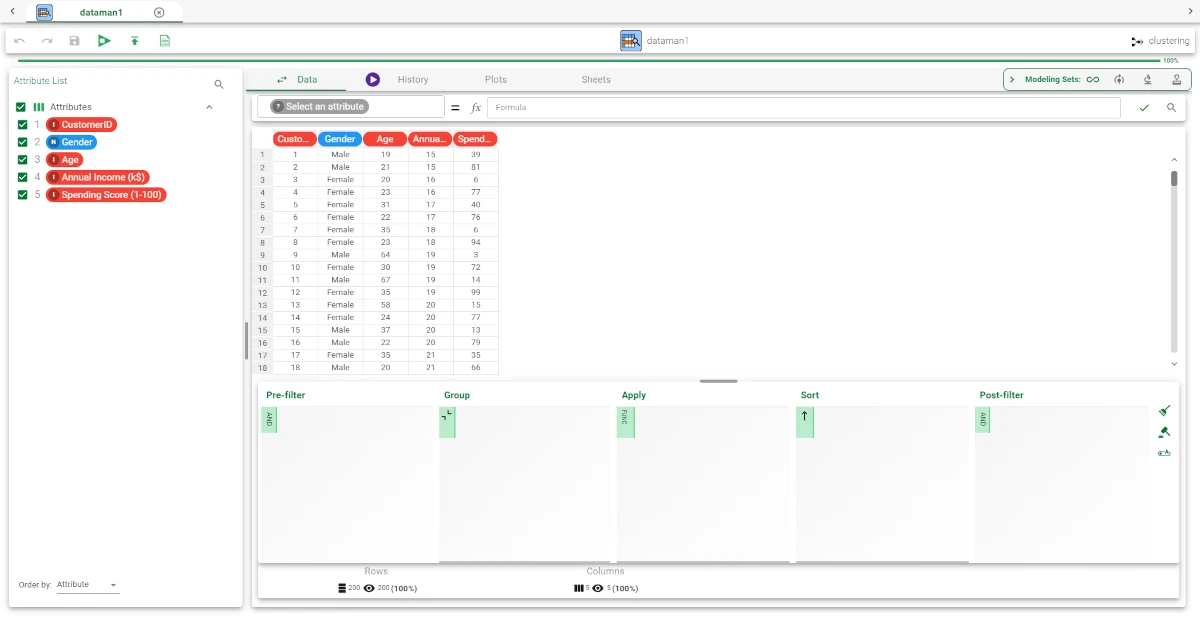
Example
After having imported the selected dataset through an Import from Text file task, drag a Data Manager onto the stage and connect it to the Import from Text file task. Configure the task as explained above, then save and compute the task.
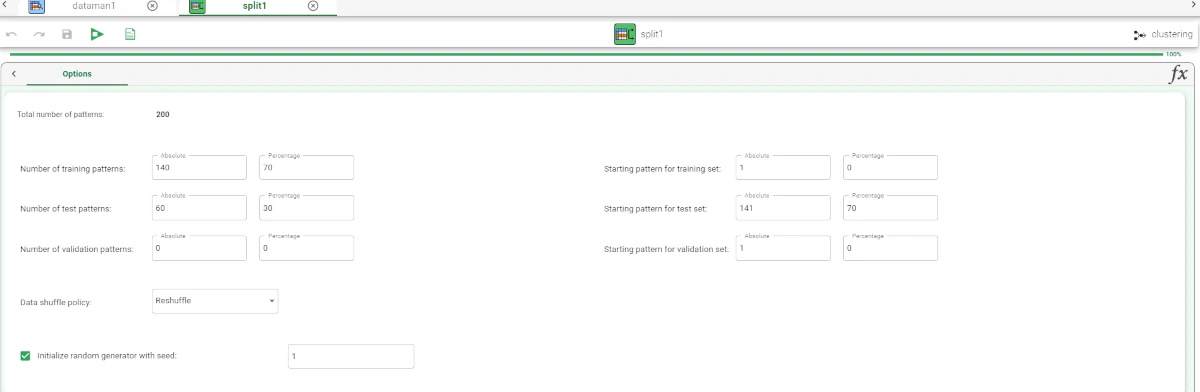
Drag a Split Data task onto the stage to randomly split the dataset into two subsets (test and training set; 30% test and 70% training) and connect it to the Data Manager. Save and compute the task. Then, drag a Standard Clustering (K-means) task onto the stage and link it to the Split Data task and configure it as explained in the sections above. Save and compute the task.
The properties and characteristics of the new generated clusters can be visualized in the Monitor tab and in the Clusters tab.