Hierarchical Basket Analysis
The Hierarchical Basket Analysis task generates association rules from frequent itemsets identified by the Frequent Itemsets Mining task.
The task is divided into three tabs:
the Options tab, where you can configure the analysis features.
the Association rules tab, where you can visualize the generated association rules in a spreadsheet format.
the Results tab, where results on computation are shown.
The Options tab
The Options tab contains all the task’s features that can be customized to obtain the desired output.
It is divided into three tabs: the Basic, the Advanced and the Output tabs.
The Available attributes list is always displayed, no matter which Options tab is opened.
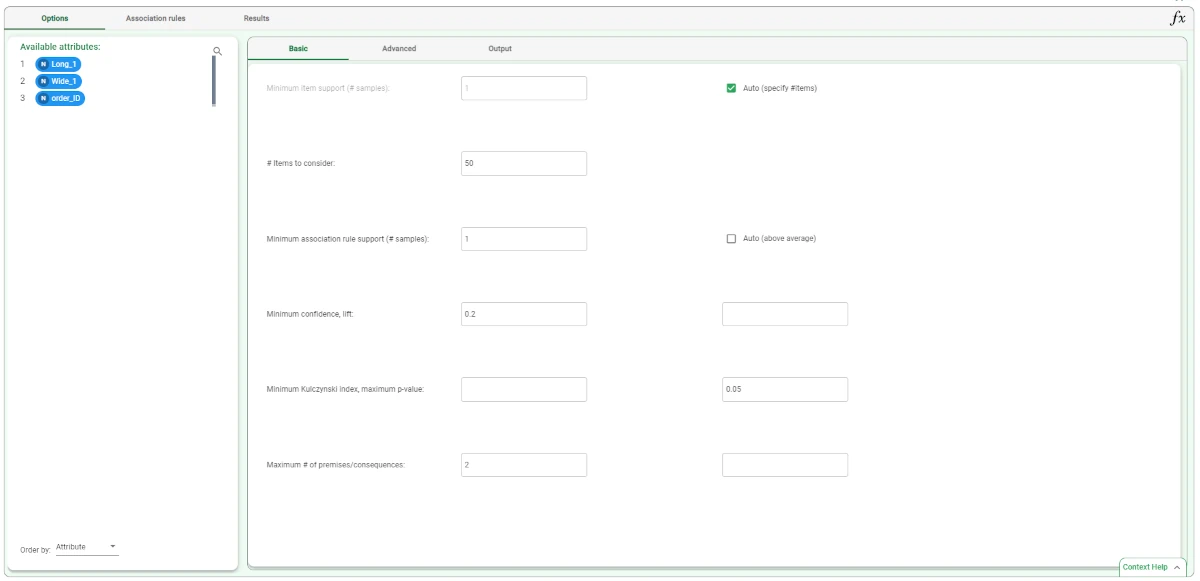
Basic tab
The Basic tab has a full range of options:
Minimum item support (#samples): all items which appear in orders fewer times than this threshold are discarded.
This option is enabled only if Auto (specify #items) option is not selected.Auto (specify #items): if selected, the minimum support for items is automatically computed according to the minimum number of items to take into account specified in the #Items to consider option.
# Items to consider: the number of items to take into account (most frequent first).
This option is enabled only if the Auto (specify #items) option is selected.Minimum association rule support (# samples): all association rules which are verified fewer times than this threshold are discarded.
This option is enabled only if Auto (above average) option is not selected.Auto (above average): if selected, the minimum association rule support is set to the average support of rules with the same dimension (i.e. with the same premise(s)+consequence(s) number).
Minimum confidence, lift: the minimum confidence (text field on the left) and the lift value (text field on the right) for association rules.
- Minimum Kulczynski index, maximum p-value: define values for:
The minimum Kulczynski index (text field on the left). This index is defined as the average between two ratios: the first is constituted by the support of the considered rule divided by the support of its premise(s), the second is constituted by the support of the considered rule divided by the support of its consequence(s). This association rule belongs to the category of null-invariant measures, which means that the value of the Kulczynski index is not affected by the number of transactions which do not include the premise(s), or the consequence(s) of the considered rule.
The maximum p-value for association rules (text field on the right). Each association rule corresponds to a 2x2 contingency matrix with premises and consequences defining its rows and columns (both the premises and the consequences can be either true or false, which is why we have a 2x2 table). The p-value measures the probability of the null hypothesis associated to the considered rule: i.e. the probability that premises and consequences are uncorrelated.
Maximum # of premises/consequences: the maximum number of premises (text field on the left) and consequences (text field on the right) of the association rules.
Advanced tab
In the Advanced tab, you will find two Attribute filters related to the following options:
Attribute to filter to select rows including relevant items: drag the attribute from the Available attributes list to specify a filtering criterion.
Items satisfying this criterion are considered as items to be replaced, regardless the number of transactions in which the item appears, that is its support.Attribute to filter to discard rows including irrelevant items: drag the attribute from the Available attributes list to specify a filtering criterion.
Items satisfying this criterion are considered as items to be discarded, regardless the number of transactions in which the item appears, that is its support. If both the selecting and the discarding filters are specified, the discarding filter prevails.
Output tab
In the Output tab, you can set the output’s features. The following options are provided:
No maximum # of premises/consequences: if selected, no maximum number of premises can be specified.
Minimum number of different attributes involved in each rule: specify the minimum number of different attributes that must be included in each role.
Negative rules (NOT A implies B, A implies NOT B): if selected, negative rules are also generated. Negative rules are rules for which premise(s) or consequence(s) appear in negative form. For instance: A implies NOT B or NOT A implies B.
Maximum Kulczynski value which triggers the check for negative rules: considering that the presence of a high value for the Kulczynski index identifies a strong and robust correlation between premises and consequences constituting a rule, the same index can also be used, from another perspective, to guide the mining of negative rules.
Consequently if the Kulczysnki index is low (up to the specified maximum value), it is evaluated if the considered rule becomes strong when expressed in negative form (for instance when denying the premise).
This option is enabled only if the Negative Rules (NOT A implies B, A implies NOT B) option is selected.Maximum # of premises/consequences, negative rules: the maximum number of premises and consequences of the association rules.
This option is enabled only if the Negative Rules (NOT A implies B, A implies NOT B) option is selected.
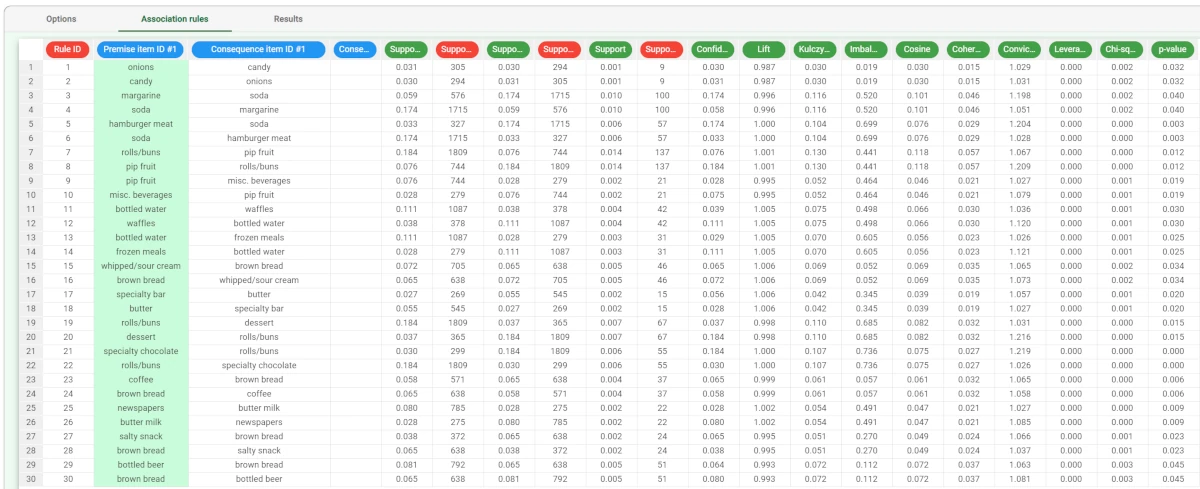
The Association rules tab
In the Association rules tab, the details about the generated association rules are provided in a spreadsheet format.
The spreadsheet contains the following attributes:
Rule ID: the association rule ID.
Positive/negative premise(s): distinguish between positive and negative premises. This column is created if the Negative Rules option is selected. If negative premises are listed in the current row, NOT is printed is this column; otherwise nothing is printed.
Premise Item ID #: the Item IDs of premises.
Positive/negative consequence(s): distinguish between positive and negative consequences. This column is created if the Negative Rules option is selected. If negative premises are listed in the current row, NOT is printed is this column; otherwise nothing is printed.
Consequence Item ID: the Item ID(s) of consequences.
Support premise(s): the percentage of orders in which premise(s) appear in the dataset.
Support # premise(s): the number of times in which premise(s) appear in the dataset.
Support consequence(s): the percentage of times consequence(s) appear in the dataset.
Support # consequence(s): the number of times in which consequence(s) appear in the dataset.
Support: the relevance of the considered rule, i.e. it counts how many transactions include both all premises, and is expressed as a percentage with respect to the total number of orders.
Support #: the relevance of the considered rule, i.e. it counts how many transactions include both all premises, and is expressed in absolute terms.
Confidence: the reliability of the considered association rule. More specifically, it measures the following: if all the items in the premise of the rule are bought, how often are all the ones in the consequence bought too. Confidence values are comprised between 0 and 1.
Lift: a relative measure of interdependence between premises and consequences. If consequences are independent of premises, lift is equal to 1. Consequently, if the lift is greater than 1 there is a direct correlation between item purchases, while a lift lower than 1 is an indicator of inverse correlation.
Kulczynski: the Kulczynski value for the considered association rule. It is the arithmetic mean of the confidence measures of two items.
Imbalance ratio: the imbalance ratio for the considered association rule. It is the imbalance between two itemsets.
Cosine: a normalized interdependence measure, comprised between 0 and 1. The greater the cosine score, the stronger the interdependence between premise(s) and consequence(s).
Coherence:
Conviction: a specificity measure, proportional to confidence and inversely proportional to support. The conviction value increases for reliable and rare associations and tends to infinity if confidence is maximum (i.e. equal to 1).
Leverage: an absolute measure of interdependence between premise(s) and consequence(s). If consequence(s) are independent of premise(s), leverage is equal to 0.
Chi-square: the value of the Chi-square test. If missing, it points out that the contingency table associated to the rule does not allow a reliable p-value estimate through the Chi-square test. In these cases, the Fisher’s exact test is preferred and its p-value estimate is upper-bounded.
p-value: the probability of the null hypothesis associated to the rule (i.e. no relationship between premise and consequence).
The Results tab
The Results tab provides information about the computation. It is divided into two sections:
- The General info area provides the following information:
Task Label, which is the task’s name on the interface.
Elapsed time (sec), which indicates how long it took to complete the computation.
- The Result Quantities contains the data quantities: check the results to be visualized, then open them by clicking on the arrow button to visualize the quantities’ values. The following information is provided:
Minimum support # threshold for items: the minimum threshold for items applied during the latest computation, in absolute terms. It is divided into Item Support and Item.
Minimum support threshold for items (percentage): the minimum threshold for items applied during the latest computation as a percentage. It is divided into Item Support and Item.
Number of different items in input: the number of distinct items which were fed to the task during the latest computation. It is divided into Items, Orders, Rules.
Number of different orders in input: the number of distinct orders which were fed to the task during the latest computation. It is divided into Items, Orders, Rules.
Number of generated association rules: the number of the associative rules displayed in the Association Rules tab. It is divided into Items, Orders, Rules.
Example
After having extracted the frequent sequences with the Frequent Itemsets Mining task, add the Hierarchical Basket Analysis task to the flow.
Set the following options:
Items to consider to 50
Minimum confidence to 0.2.
Maximum # of premises to 2.
Save and compute the task.
Association rules are stored in the Association Rules tab. Each association rule will be characterized by premise(s) and consequence(s). If, for instance, a rule includes tropical fruit as a premise and citrus fruit as a consequence, it means that if a transaction includes a tropical fruit, it is also likely to include a citrus fruit.
Different indicators qualify and quantify the strength of this cross-selling relationship. To view which rules have the highest confidence, right-click on the Confidence column in the Association Rules tab and select Sort Descending.
We can now perform a few further steps in order to analyze the extracted rules in further detail, and perform filtering and statistical operations on the rules.

- In order to view the rules themselves and not just the dataset we can import the rules only by adding an Import From Task task to the flow.
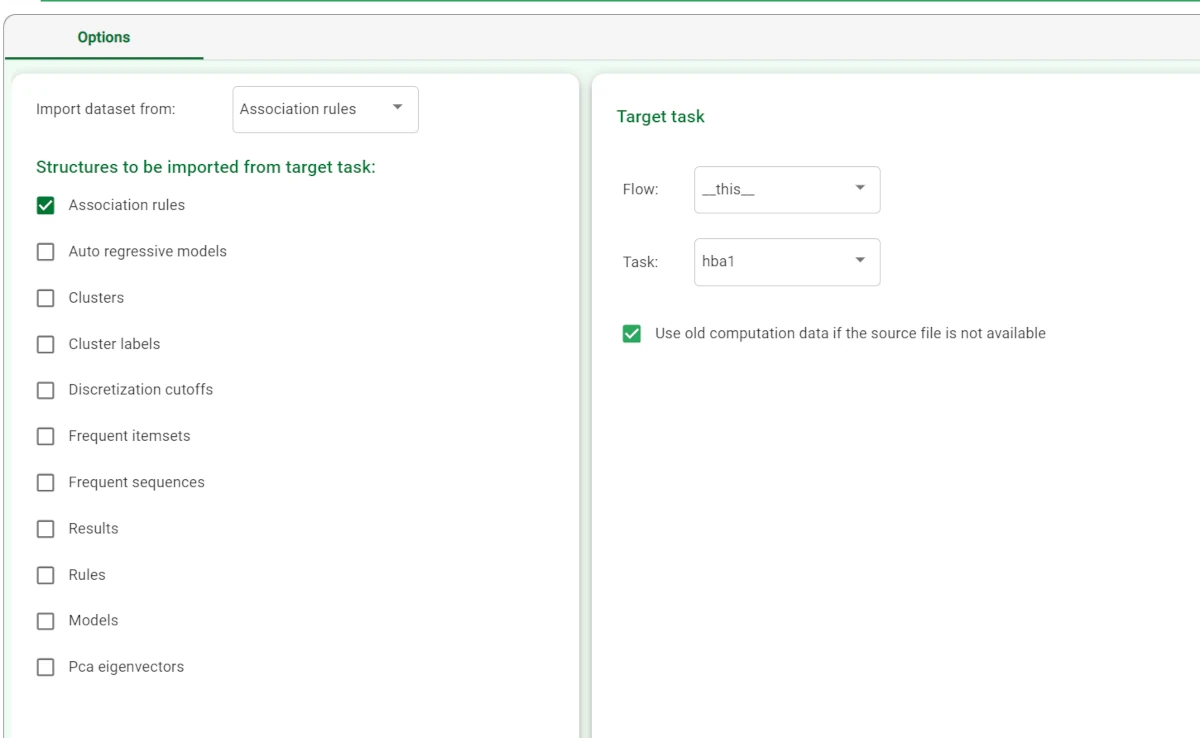
Double-click the task and select: Process: the name of the flow you are working on.
Task: the name of the Hierarchical Basket Analysis task, Hba1 in our scenario.
Import dataset from: Association rules.
Structures to be imported from target task: Association rules
- In order to view the rules themselves and not just the dataset we can import the rules only by adding an Import From Task task to the flow.
Save and compute the task.
Add a Data Manager task to the Import from Task to analyze the rules by filtering them in the Query Manager pane.
In this example, we wanted to filter all the values in the Lift attribute higher than 1.
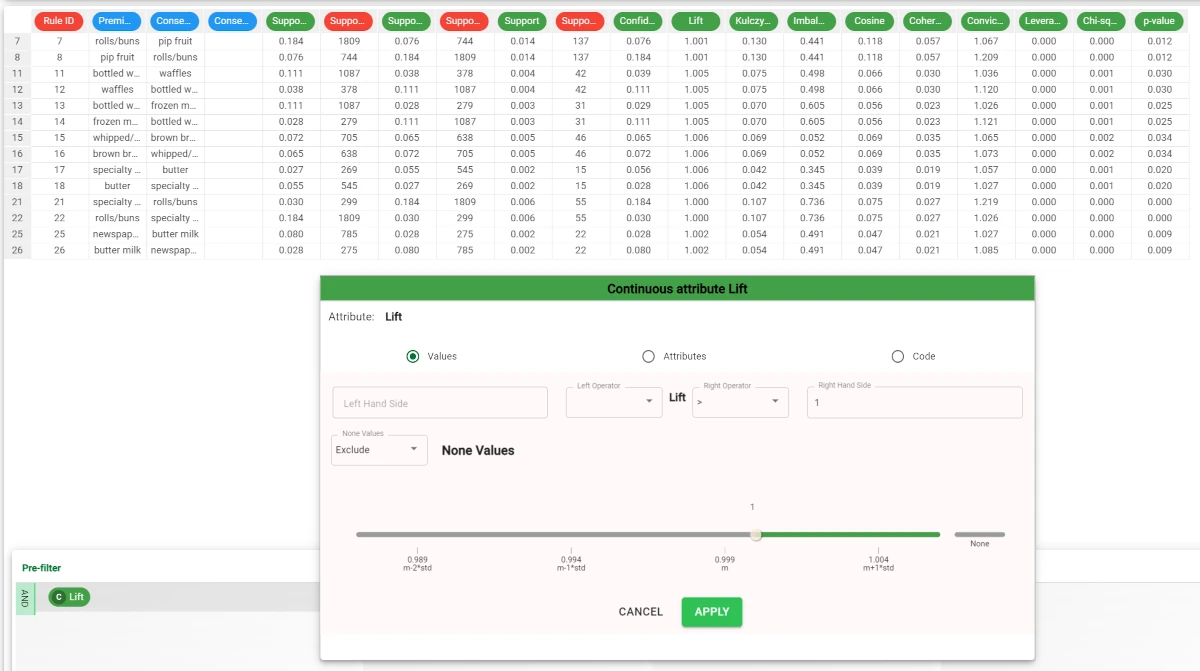
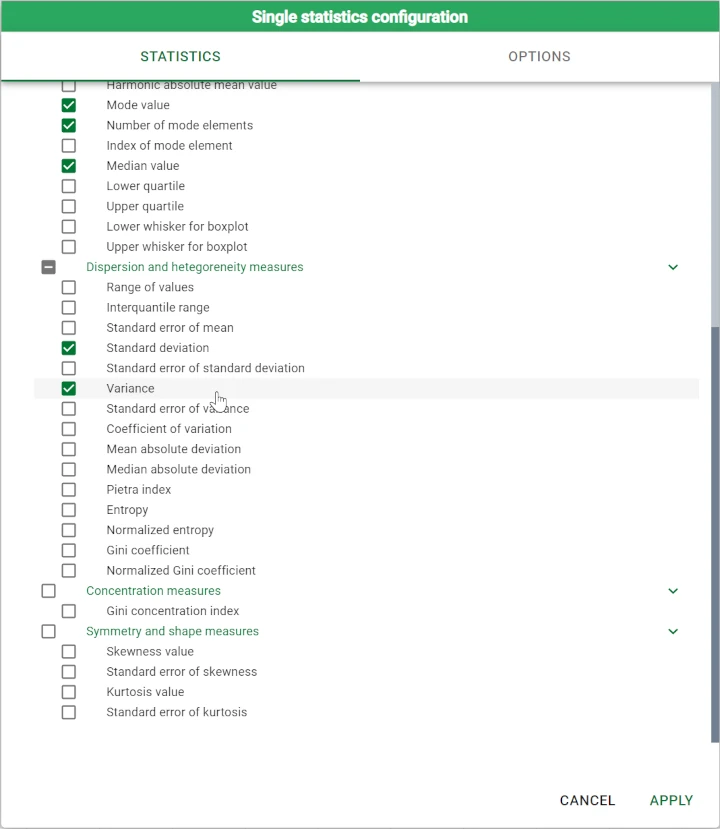
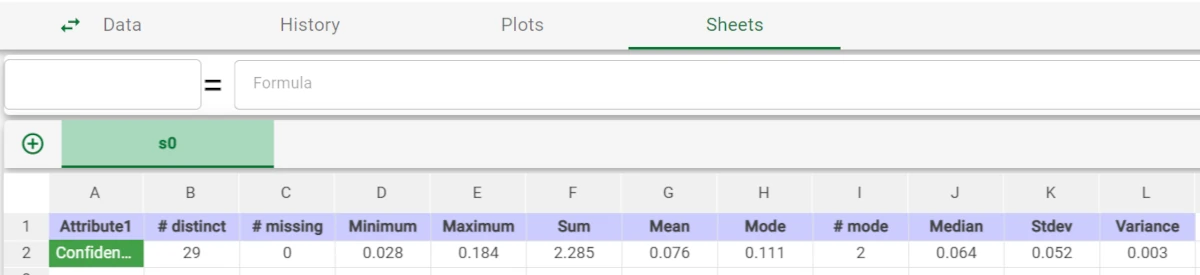
Alternatively you could also compute min/max or average values in the Sheets tab. For example by using the Variance option from the univariate statistics on the Confidence attribute, as in the example.