Confusion Matrix
The Confusion Matrix calculates and visualizes the performance of any classification method. Each column of the matrix corresponds to the patterns in a predicted class, whereas each row corresponds to the instances in an actual class.
Confusion Matrix layout
The Confusion Matrix task is made of only one tab, which is divided itself into three panes:
The Options, where users can configure different options.
The Confusion Matrix, where users can view the percentages of correctly and incorrectly forecast samples in a grid.
The Confusion Plot, where users can view the same information contained in the Confusion Matrix pane, but in a more readable grid.
Options
Within this pane, users can set the following options:
Show percentage. If selected, the percentage in the table in parentheses will be displayed.
Outputs. Through the drop-down list, users can select the preferred output attribute.
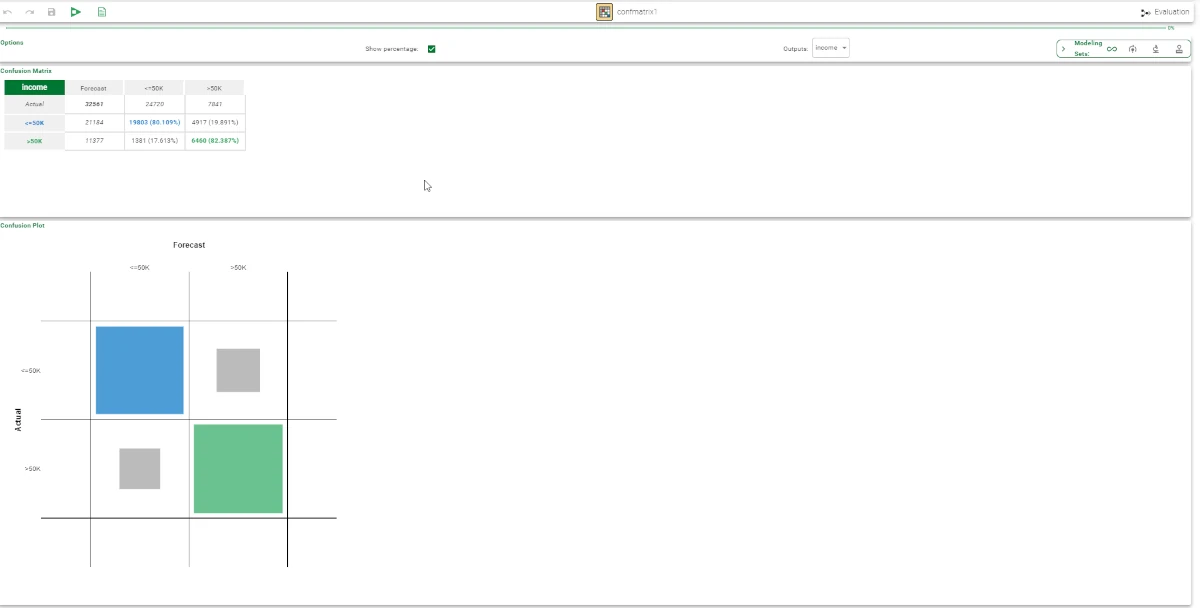
Confusion Matrix
Within this pane, the numerical matrix represents the percentages of correctly and incorrectly forecast samples in a grid.
Confusion Plot
This pane contains a matrix that graphically displays the same information in a more readable grid, with each column representing patterns in a predicted class and each row representing instances in an actual class.
By hovering over the previously mentioned matrix, users will find the following customized plot visualization:
Download plot as a png
Zoom
Pan
Box select
Lasso select
Zoom in
Zoom out
Autoscale
Reset axes
For more information about the above-mentioned plots, please refer to the Data Manager page.
Example
After having imported the dataset with the Import from Text File task, split the dataset into test and training sets (30% test and 70% training) with the Split Data task. Then, compute a LLM Classification task, specifying the Income attribute as Output. Apply the model with the Apply Model task leaving the default options. Add a Confusion Matrix task and link it to the Apply Model task.

The test set’s confusion matrix demonstrates that the majority of errors are due to misclassification between class >50K and <=50K. Essentially, there are few examples of class <=50K being classified as >50K, but many examples of class >50K being classified as <=50K. Although the confusion matrix may seem trivial in a two-class problem, when more classes are present, the information contained in the matrix may help to understand the phenomenon under examination and improve classification accuracy.