Moving Window
Moving window statistics define temporal windows of data of a specific size and shape. The data within the specific window can be statistically summarized, using operations such as minimum / maximum values, standard/absolute deviation, mean, median and mode.
For each selected variable the rows of the resulting dataset will include, beside the present value, some of its past values and some of its future values (possibly resulting from aggregation), according to user selection. The suffixes -1, -2, etc. are added to the attribute name to denote past intervals, whereas the suffixes +1, +2, etc. are added for future values. Time relationships are established by looking at a specified temporal attribute or by using the row number (possibly in reverse order).
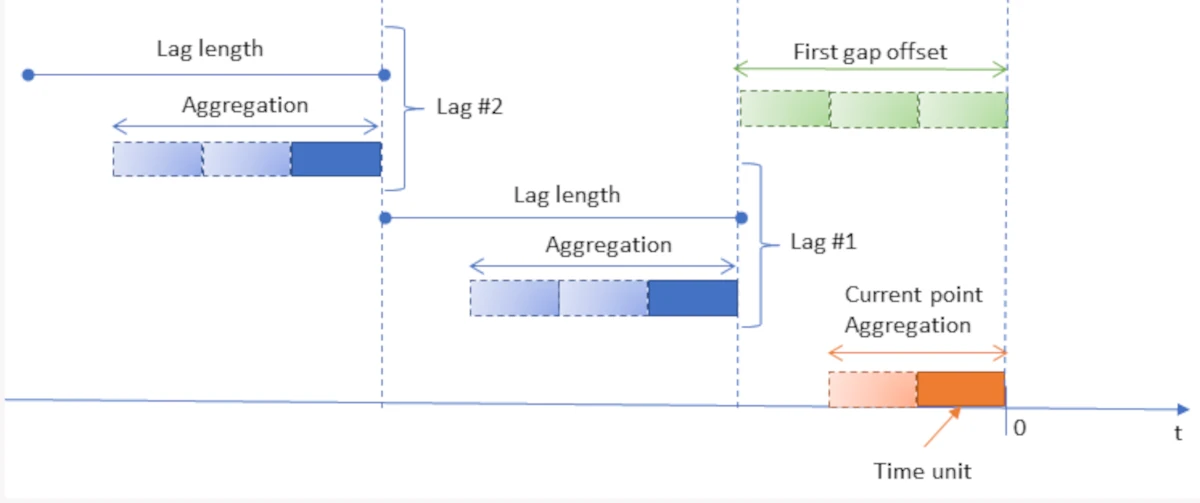
The graphic displayed in the Time Legend tab helps understand the temporal positioning of the various configurable options:
The Moving Window task is made of the Options tab only. It is divided into two main areas:
The Available attributes area, where you can uncheck the attributes you want to remove from the analysis (for more information see the corresponding page). Right-clicking this panel gives access to some additional options, such as checking/unchecking all attributes, inverting your selection, hiding ignored attributes, etc.
The configuration area, which is further divided into two tabs, the Basic tab and the Advanced tab, which will be analyzed in the sections below.
The Basic tab
In the Basic tab, you can set all the basic configuration options for your analysis. To make it easier to configure, it has been divided into three smaller sections, each one indicating the type of the options within them. The Basic tab is divided into:
General
In the General section, you will find all the following general configuration options:
Attributes subject to moving window operations: drag the attributes you want to apply moving window operations to. Attributes can also be defined via a filtered list.
Key attributes: drag the attributes that will control the moving window process from the attributes list. A separate application of the task is performed for any group of different values assumed by the key attributes. Attributes can also be defined via a filtered list.
Time attribute: select a Time attribute from the drop-down list to specify the temporal attribute to be used to set the moving window. If not specified, row numbers will be used to establish the time relationship.
Time unit: specify the number of time units that determine a step back in the past or forward in the future (deltatime) and the unit of measure to be considered (timeunit). Possible values are second(s), minutes(s), hour(s), day(s), week(s), month(s), quarter(s), year(s).
Remove incomplete initial rows: select if you don’t want any initial rows containing missing data to be included in the resulting dataset. This may happen if the number of past intervals is not null, since not all the previous values will be available.
Remove incomplete final rows: select if you don’t want any final rows containing missing data to be included in the resulting dataset. This may happen if the number of past intervals is not null, since not all the previous values will be available.
Consider only one row for each time interval: if selected, only one row for each time interval is kept.
Perform nested aggregation inside moving window: if selected, the aggregation operator is applied at first inside a time interval, then at the moving window level.
Fill missing values: select if you want all the missing data in the resulting dataset to be filled with the nearest non-missing value in the right direction of time; in particular, past missing data are filled by checking subsequent values, whereas future data are filled by checking previous values.
Past samples
In the Past samples section, you will find the following configuration options for the past intervals:
Number of lags: specify the number of past intervals for each variable that will be added to the resulting dataset.
Lag length (time unit): specify the length of each past interval (expressed in time units).
Future samples
In the Future samples section, you will find the following configuration options for the future intervals:
Number of lags: specify the number of future intervals for each variable that will be added to the resulting dataset.
Lag length (time unit): specify the length of each future interval (expressed in time units).
The Advanced tab
In the Advanced tab, you can set all the advanced configuration options on the attributes. To make it easier to configure, it has been divided into four smaller sections, each one indicating the type of the options within them. The tab is divided into:
General
In the General section the following options are available:
Type of aggregation for ordered attributes: select which type of aggregation you want to use for ordered attributes from the drop-down list. Possible values are Minimum (1), Maximum (2), Sum (3), Mean (4), Median (5), Mode (6), Standard deviation (7) or Absolute deviation (8).
Type of aggregation for nominal attributes: select which type of aggregation you want to use for ordered attributes from the drop-down list. Possible values are Minimum (1) Maximum (2) or Mode (6).
Use ratio values: if selected, past and future intervals will not be absolute, but will correspond to their ratios, according to the current value. The ratio will be calculated between the shifted values and the original values.
Use trend values: if selected, past and future intervals will not be absolute, but will correspond to the difference between the shifted values and the original values.
Reverse the direction of time: select if you are using row numbers to establish the time relationship (as you have not specified a specific time attribute), and you want time to flow in the opposite direction with respect to row numbers.
Present samples
In the Present samples section the following options are available:
Number of time units for aggregation (current point): specify the number of time units you want to use to modify the current point. If you leave the value 1 no aggregation operations will be performed.
Past samples
In the Past samples section the following options are available:
First gap offset (time unit): length of the gap between the current time period and the first period in the past (expressed in time units).
Number of time units for aggregation: specify the number of time units you want to use for past aggregation.
If you leave the value 1 no aggregation operations will be performed; any values greater than 1 mean that a rolling mean (or a rolling mode in case of nominal variables) is performed for each past value to be added to the resulting dataset; the inserted integer value gives the number of pastime periods to be considered for the rolling mean.
If a Time attribute is defined, the distance is measured according to the specified time unit and the value provided for the Number of time units for aggregation, otherwise it is simply given by the number of rows.
Future samples
In the Future samples section the following options are available:
First gap offset (time unit): length of the gap between the current time period and the first period in the future (expressed in time units).
Number of time units for aggregation: Number of time units for future aggregation.
If you leave the value 1 no aggregation operations will be performed, any values greater than 1 mean that a rolling mean (or a rolling mode in case of nominal variables) is performed for each future value to be added to the resulting dataset; the inserted integer value gives the number of future time periods to be considered for the rolling mean.
Example
After having imported the dataset, right-click the import task and select Take a look to check the data have been correctly imported.
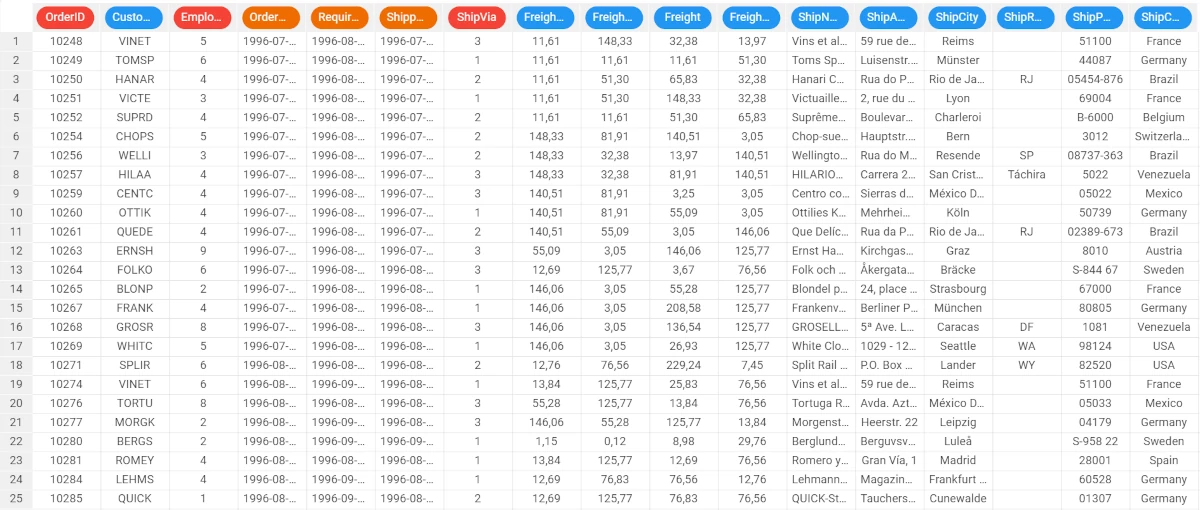
The original dataset is made up of 830 records and 14 attributes concerning orders, with various data types. Three of these attributes are dates that record the time of subsequent steps in processing orders. In particular, the ShippedDate variable provides the shipping date for each order.
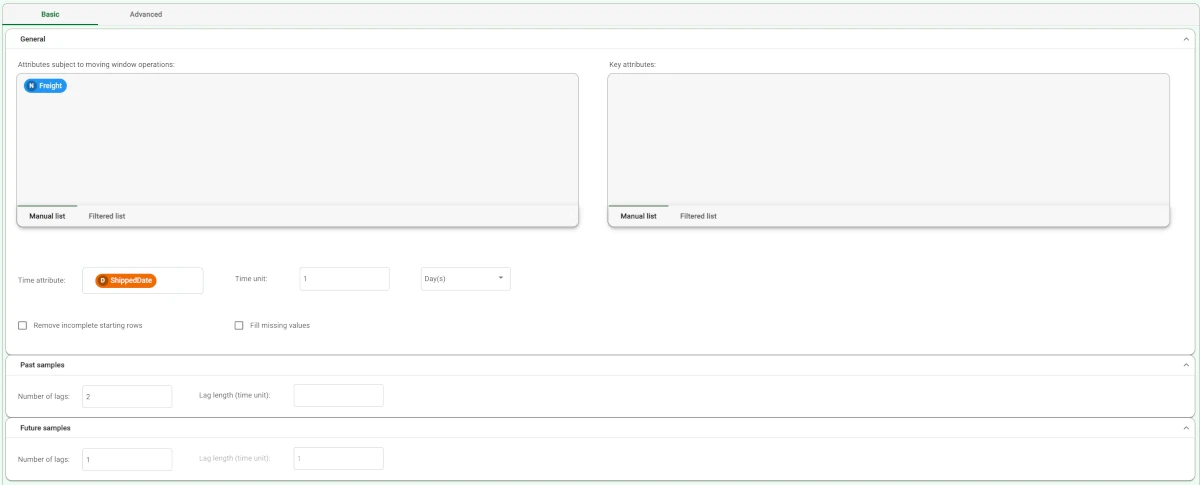
- Drag the Moving window task onto the stage and link it to the source task. Set the parameters as follows:
Attributes subject to moving windows operations: Freight
Past samples - Number of Lags: 2
Future samples - Number of Lags: 1
Time attribute: ShippedDate
Time interval for aggregation: 1
Time measure unit: day(s)
Save and compute the task. Only the Freight attribute is affected by the moving window process, with 2 past intervals and one future interval, by using the ShippedDate attribute to determine time periods (with a lag of one day).
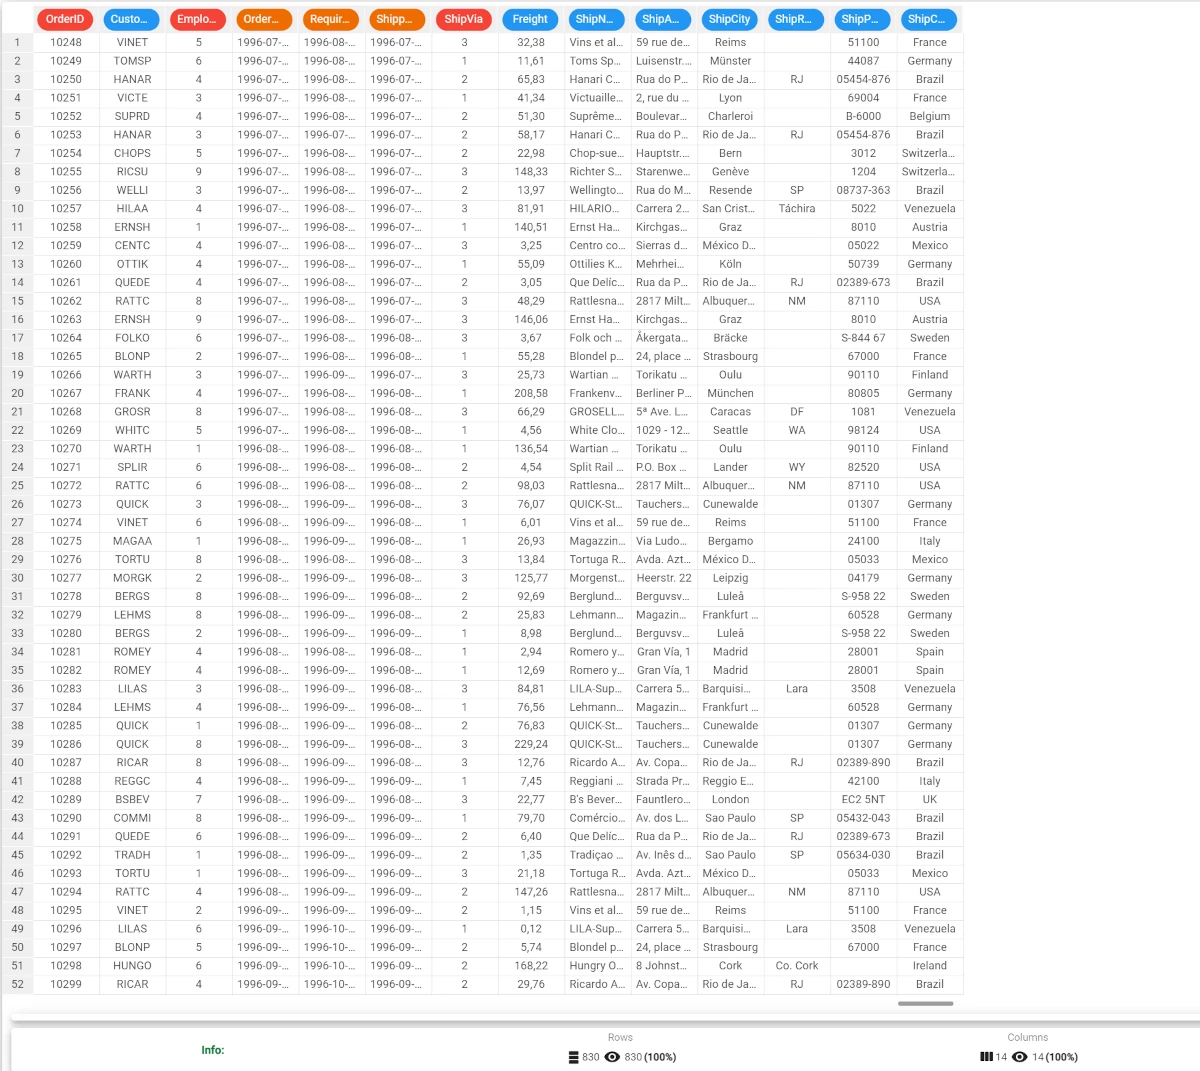
- Right-click the task and select Take a look to visualize the resulting data. Three additional attributes are added to the original dataset:
Freight-2 contains the values for the past intervals
Freight-1 contains the more recent values for the past intervals
Freight+1 includes the values for the future interval.
By sorting on the ShippedDate attribute the effect of the moving window appears clear, since values in columns Freight-2, Freight-1, Freight, and Freight+1 are shifted to the right when moving down, row after row.
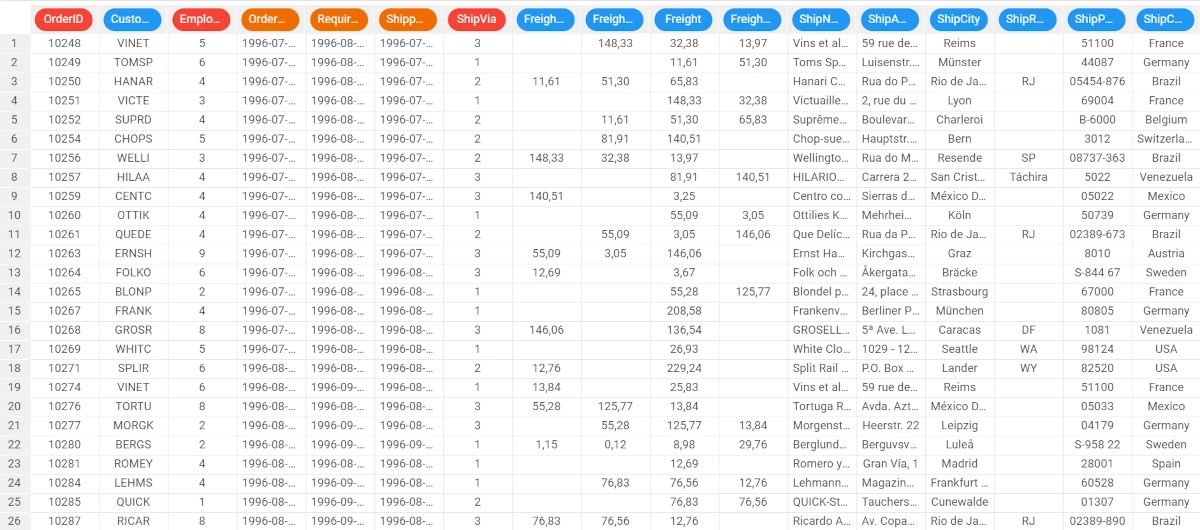
Several values in the resulting dataset are missing since not all the dates are included in the ShippedDate column.
If you would prefer not to have missing values, and fill all the cells in the Freight-2, Freight-1, Freight, and Freight+1 attributes, select the Fill missing values option in the Moving Windows task and recompute.
The resulting table is as displayed here: