Evaluating statistics
One of the main properties of Rulex Factory Data Manager task is its ability to evaluate statistics on an underlying dataset through simply drag-and-drop operations and to automatically populate a dedicated visualization sheet.
All these operations are performed in the Statistic panel. A general overview about this panel has been given in the sheets tab page.
The general statistical evaluation approach and the four areas composing the Statistic panel will be covered here.
To create univariate statistics of multiple attributes in the Sheets tab, follow the guidelines below:
Procedure
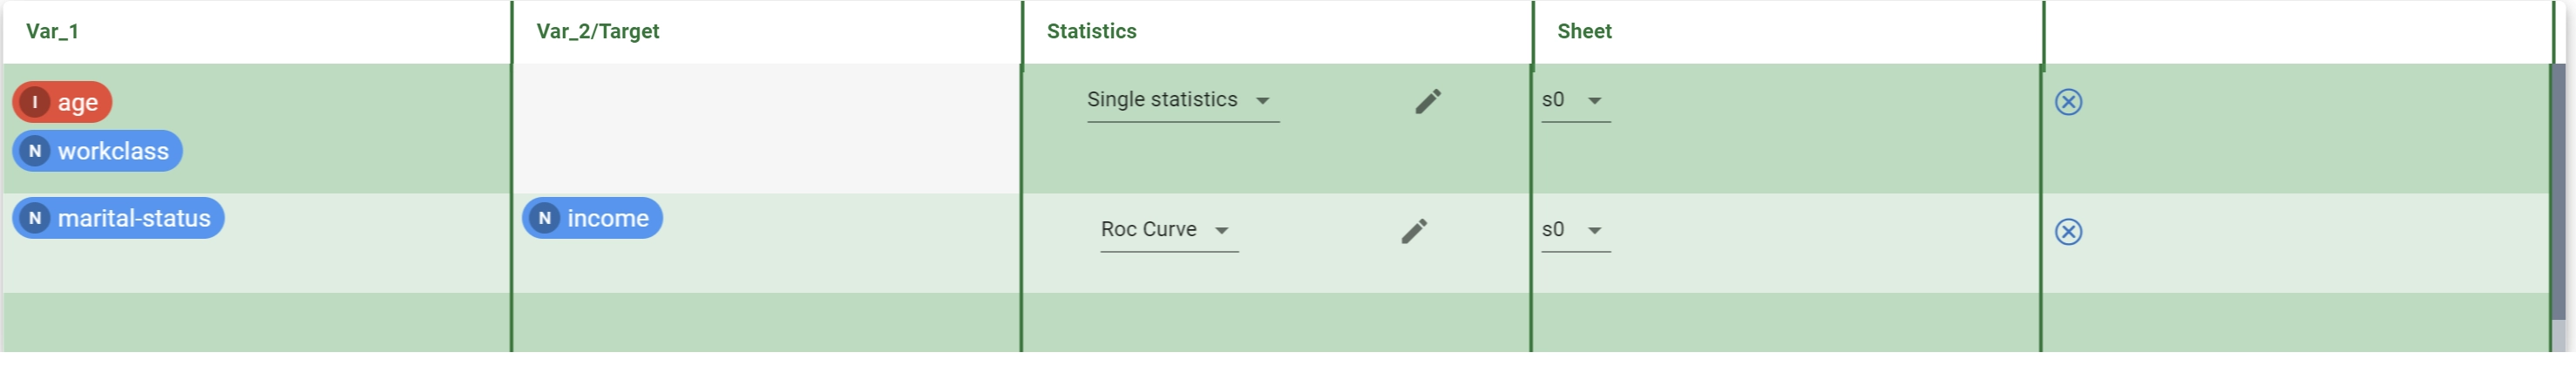
Select an attribute from the Attribute list and drag one of its chips onto the Var_1 column of the Statistic panel. The results (Single statistics by default) are displayed in the Sheet panel.
Select another attribute and just drag it onto the next rows of the Statistic panel. The results of this last attribute will be displayed in a new row of the Sheet panel.
Click on the pencil icon in the Statistics area to edit the stats configuration of the chosen attribute.
Note
If you want to calculate bivariate statistics, you also need to select another attribute from the Attribute list and drop it onto the Var_2/Target column. Please note that all operations performed in the Statistic panel can be undone and redone at any time.
Input areas
Input areas correspond to the first two areas from the left to the right of the Statistic panel. Here is where users provide input attributes for their evaluation. Any statistic evaluation requires at least an input attribute which is mandatory and provided by using the first area Var_1.
Some classes of statistics require further input information: you can actively incorporate these additional attributes by dragging and dropping them into the second area of the Statistic panel, labeled as the Var_2/Target column.
Any of these areas are organized in rows. Any row in any area can contain an arbitrary number of attributes. All these attributes will be used to construct the same unique table result. If configurations of a single row are modified, the whole row will be re-evaluated, leading to the complete erasure and redraw of the corresponding table on the sheet.
In case of a multivariate problem where two input attributes or one input attribute and one target attribute are used, if more than one input is contained in the two areas for a single row, the resulting outcome will pair the two lists based on their common indexes. If one of the two lists is longer, the remaining attributes will not be matched and will consequently be ignored.
You can move attributes from one area to another one or from one row to another one or simply rearrange attributes within the same row using simple drag and drop operations, a similar process is also used when adding attributes from the Attribute list.
Statistics area
In the Statistics area, we define the type of statistic evaluation the system has to compute for the presently considered row.
All stats available in Rulex Factory are divided in two macro classes:
- Univariate: involving only one input attribute for its evaluation. The following subclasses are encompassed in this group:
Single statistics
Values, frequencies and quantiles
- Bivariate: involving two input attributes for its evaluation. The following subclasses are encompassed in this group:
Single statistics
Correlation/Covariance
Cross tabulation statistics
ROC Curve
Test for independent samples
Test for paired samples
Note
The form of the resulting table, including its size, color, styling and shape, is determined by the selected subclass. Additional configurations within the same subclass only add extra information as extra columns or rows, extra values etc.
For each subclass, you have the flexibility to customize the list of stats to evaluate from the entire available list, along with various computation options. All these internal configurations can be adjusted through a dedicated statistics configuration panel, unique to each subclass. Detailed explanations regarding these panels can be found on the the Statistics configuaration panels page.
The statistics configuration panel can be opened by clicking on the pencil icon located next to the subclass statistics drop-down menu in each row of the Statistics area.
Sheet area
In this area for each row you can configure the sheet where to display the evaluated results.
Only the locked sheets are considered for automatic filling.
In each row, there is a drop-down menu containing the names of all the currently locked sheets. You can lock an empty sheet at any time by clicking on the lock icon situated in the top-left corner of the considered sheet’s header tab.
Changing the sheet of a single row in the Statistic panel will erase the associated result table from the previous sheet and redraw it in the newly selected sheet.