Input attributes in Plot
In the plot’s general overview, the base structure of the plot user interface has been presented. In Rulex Platform, inputs are linked to the various graphical dimensions available for each plot. The connection is performed through a drag’n drop operation from the Attribute list.
Anytime a new attribute is dropped on a dimension button, it is added to the input list associated with the selected dimension and the plot is automatically re-drawn according to the new input structure. Attributes associated with a single dimension button are divided into groups.
In this context, different groups in a dimension button lead to different subplots in the same single plot area. In particular, given the group structure of each dimension button involved in a particular plot type definition, the number of subplots drawn by the system is equal to the product of the numbers of different groups available on the various dimension buttons considered.
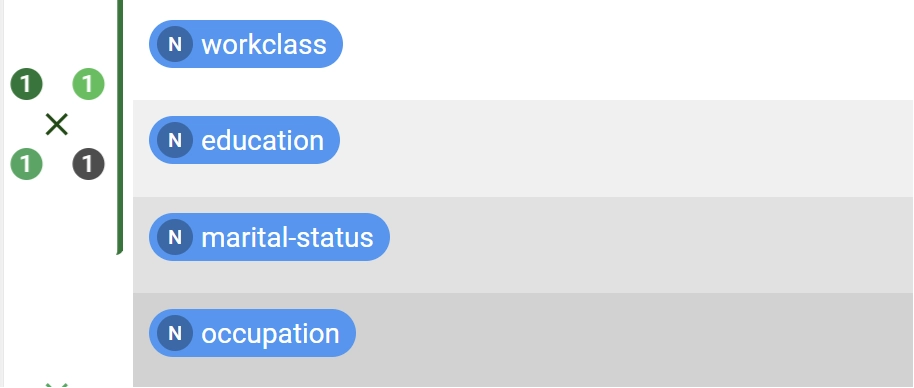
Graphically, groups present on a single dimension button are drawn as badges located on the different corners of the button. The number inside the badge represents the number of attributes contained in that particular group.
Note
The maximum number of groups on a single dimension button is 4.
When dragging new attributes from the Attribute list on a single dimension button, take into account:
If users perform a drop operation of new attributes on a button which contains already linked attributes, the new set will completely replace the old group.
By pressing Ctrl key during drop operation, users will add all the new attributes dropped each of them in a different group.
By pressing Shift key during drop operation, users will add all the new attributes to the first available group.
Even if, at first sight, badges will inform users about the exact number of attributes linked to that particular dimension, the real list can be inspected by simply left-clicking on the corresponding dimension button. In the presented popper, the whole list of the connected attributes will be shown. The background separates graphically the various contained groups.
Users are able to drag new attributes from the Attribute list directly on the presented popper. In this scenario, attributes are directly added to the final selected group. Moreover, users can start dragging attributes from this list to internally modify the input definition of the plot. If users want to move an attribute from a particular dimension to another one, they will start dragging from the first presented popper, dropping the same on the final destination button.
Hint
By left-clicking on a particular background line, users are going to select the entire group. A green background will highlight the selection. Ctrl+click and Shift+click selection procedure are still available.
Once the selection has been made, by pressing Del users can trigger the deletion of all the attributes located in the selected groups.
In a given group, if nominal or binary attributes are present, those attributes are always ordered on top of the group sub-list for graphical reasons.
See also
Right-clicking on a single dimension group will open the corresponding Dimension options menu. Detailed description about Dimension options menu for the different Dimension available is presented in this page.