The Plots tab
Different kinds of plots can be created in the Data Manager, to help you visually understand data.
The plots available are:
To start building a plot, the first step to perform is clicking on the Plots tab. Plots are organized in Pages: the first page is automatically created by the system. To add a new Page, users need to click on the Plus icon located just below the Plots tab header.
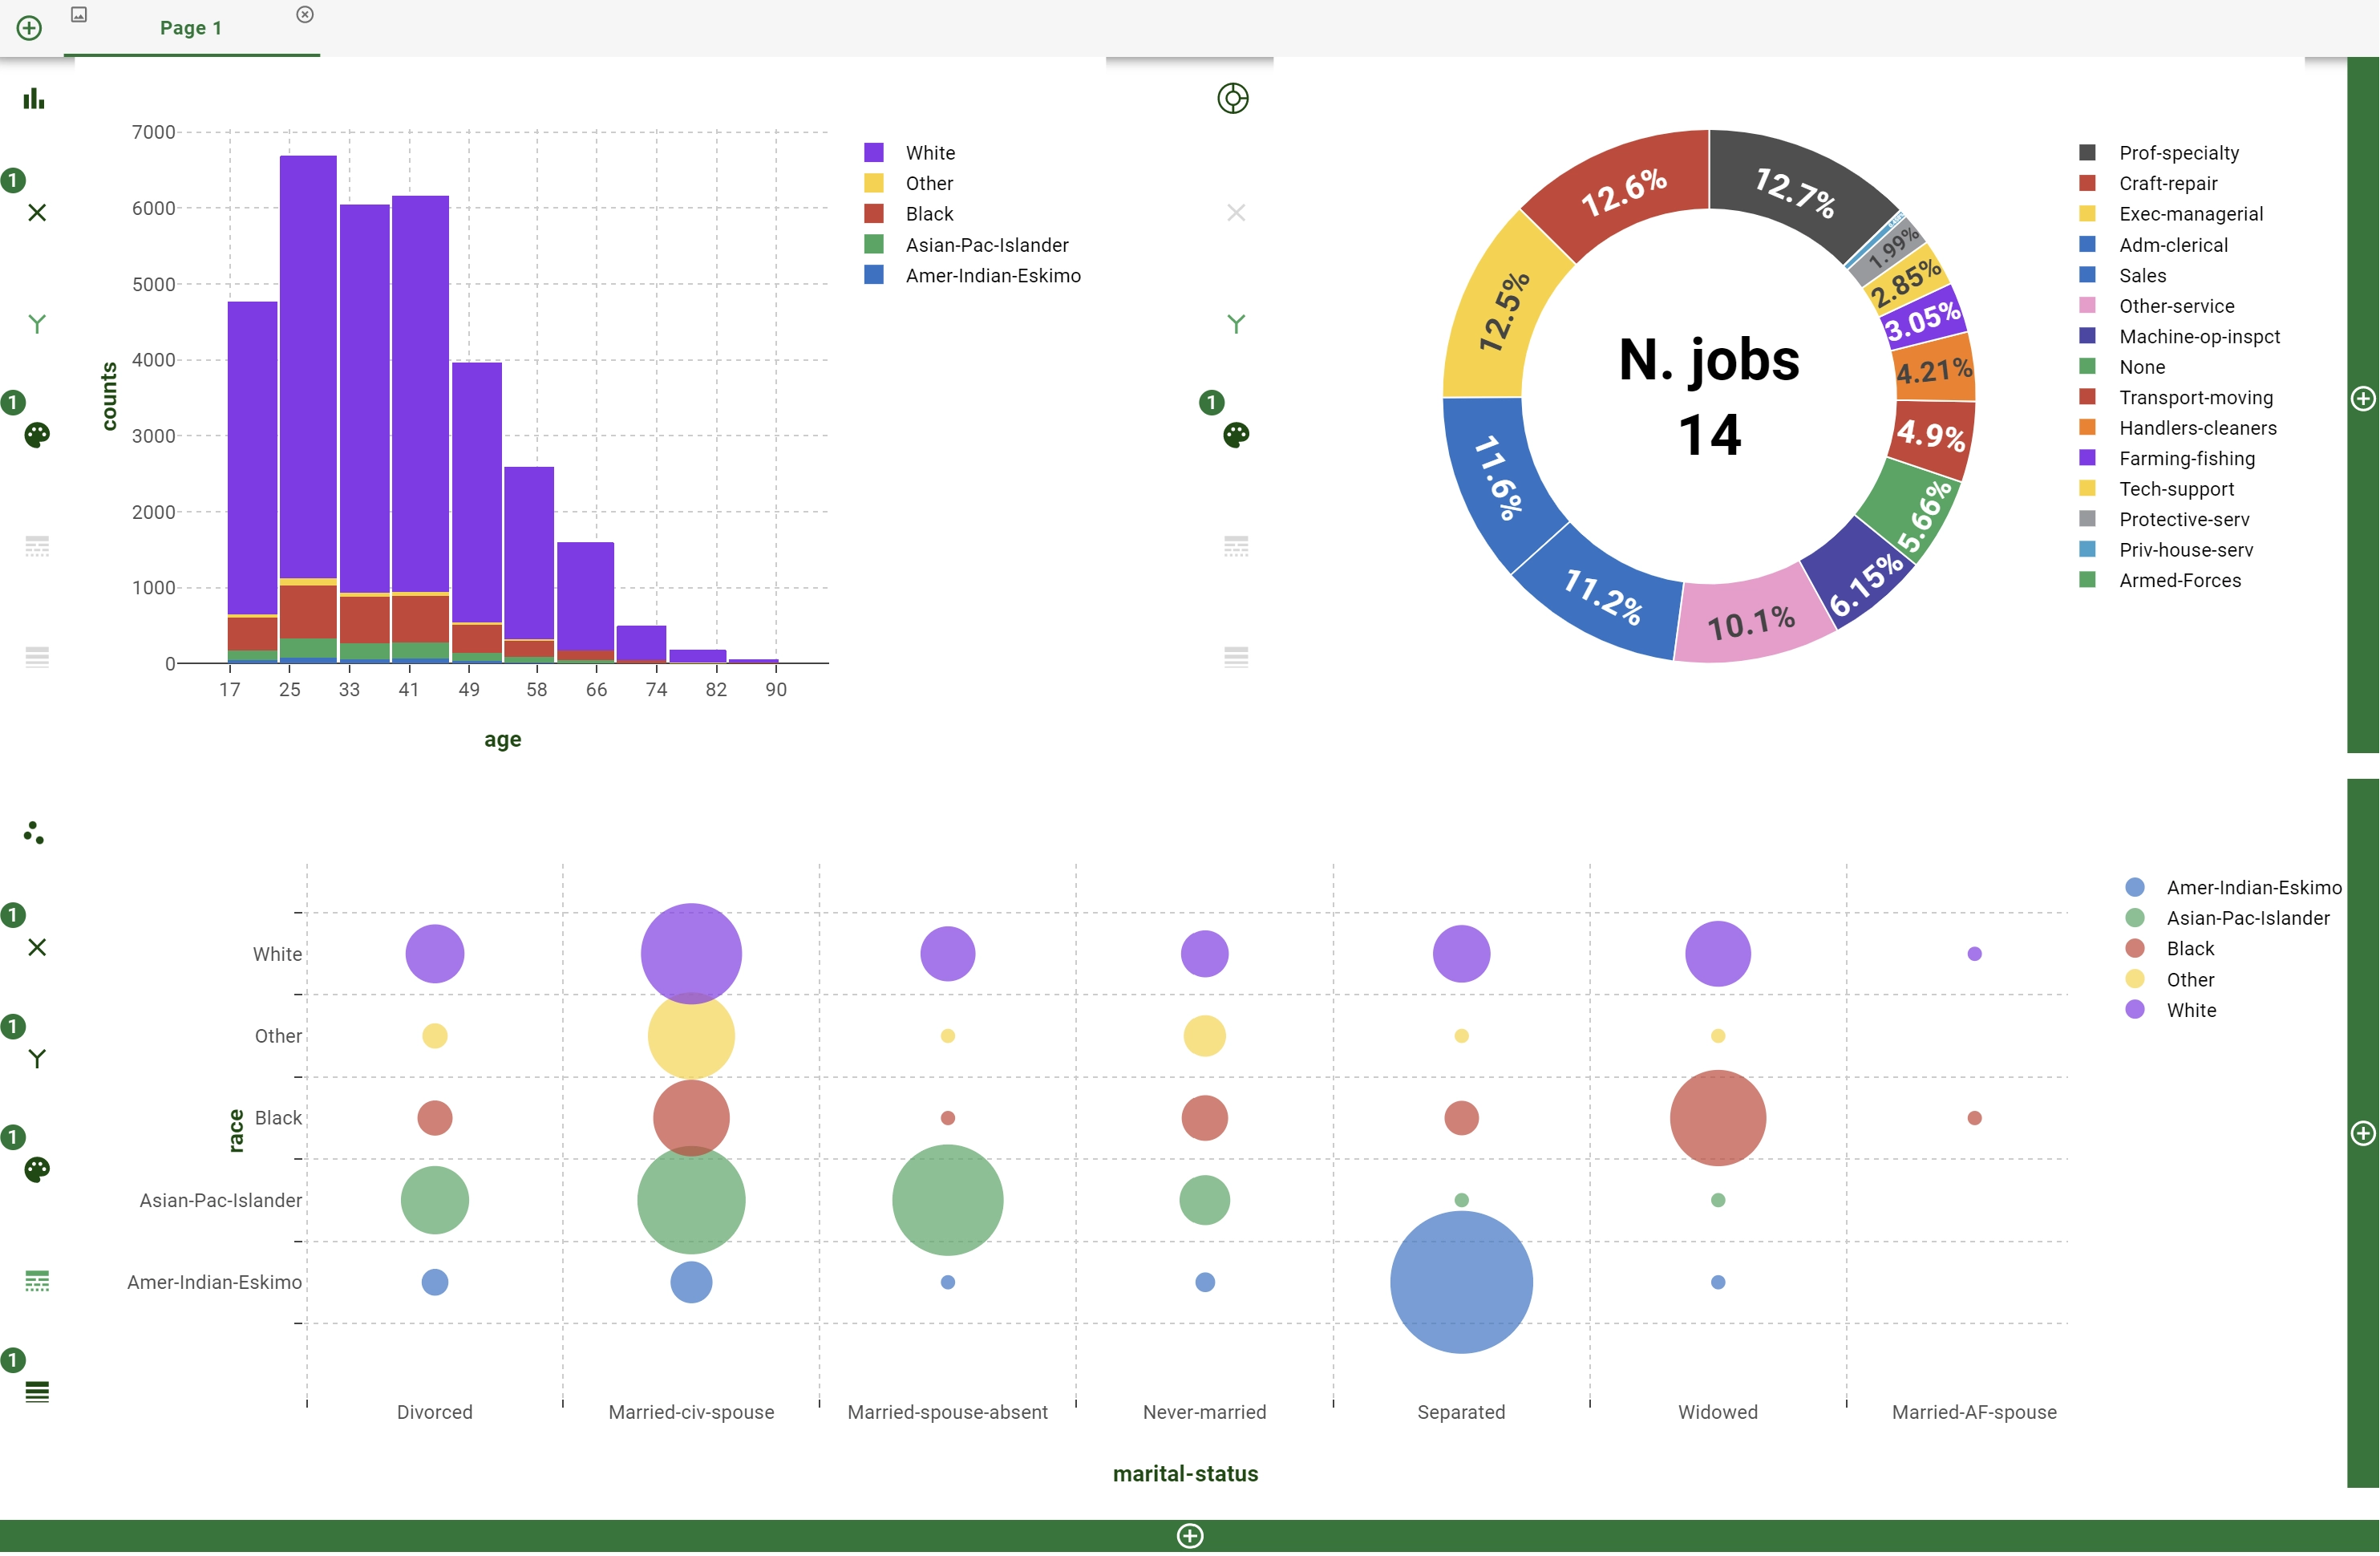
Once a page is created, the whole page is filled by a unique Plot. The Page can contain more distinct plots, adding them by simply clicking the Plus icon located at the right and at the bottom of the Page itself.
Within a single Page, Plots have a tabular based structure:
By clicking on the Plus icon located on the right, a new column will be added to the tab, meaning a new plot next to the original ones will be created.
By clicking on the Plus icon located on the bottom side, a new row to the tab will be added, meaning a new plot below the original ones will be created.
Hint
Once the Data Manager task is saved and computed, the plot is persistent. This means that if the task is closed and opened again, it is stored in the Plots tab in its original format. If users want to modify the dataset in the Data tab after having built the plot, go to the corresponding section to see how to update the plot as well.
On the header of any Page, by hovering with the pointer, some buttons performing the following operations are displayed:
Delete: located in the upper right side corner, it deletes the whole page.
Export: located in the upper left side corner, it exports as PNG image the whole page.
Single plot internal structure and its option definitions is completely described in this dedicated page.
Exporting a plot page
In certain occurrences, users want to export the built plot as a PNG image, for example to add it to their reports or presentations.
Any single plot can be exported separately by using the corresponding button located in the plot internal modebar, but sometimes the overall picture is needed. To obtain an image of the overall page, users need to click on the Export icon, located in the upper left side corner of the Page header.
At the end of the export procedure, a file save dialog window will be opened, to select the location where the file will be stored in the standalone version, while the file will be automatically downloaded in the browser’s download folder in the cloud/server/server version.
Note
During the Page export procedure, some graphical objects, used mainly for the page and plot configuration, are temporarily hidden to prevent them to be present in the final generated image.
To summarize, follow the procedure below to download the whole Page in PNG format:
Procedure
Add a new Page by clicking on the Plus icon located at the left end of the Page header bar.
Configure the Page by adding extra plots and by configuring single plots according to the directories provided in this page.
Click on the Export icon located in the upper left side corner of the just added Page header to start the export procedure.
In the Standalone version, the file save dialog window will be shown at the end to select the storing location, while in the Cloud/Server version an automatic download of the image will start at the end of the export procedure.