Vertical and Horizontal Bar Plots
A bar plot is an histogram made up of rectangular bars, whose length is proportional to the values they represent.
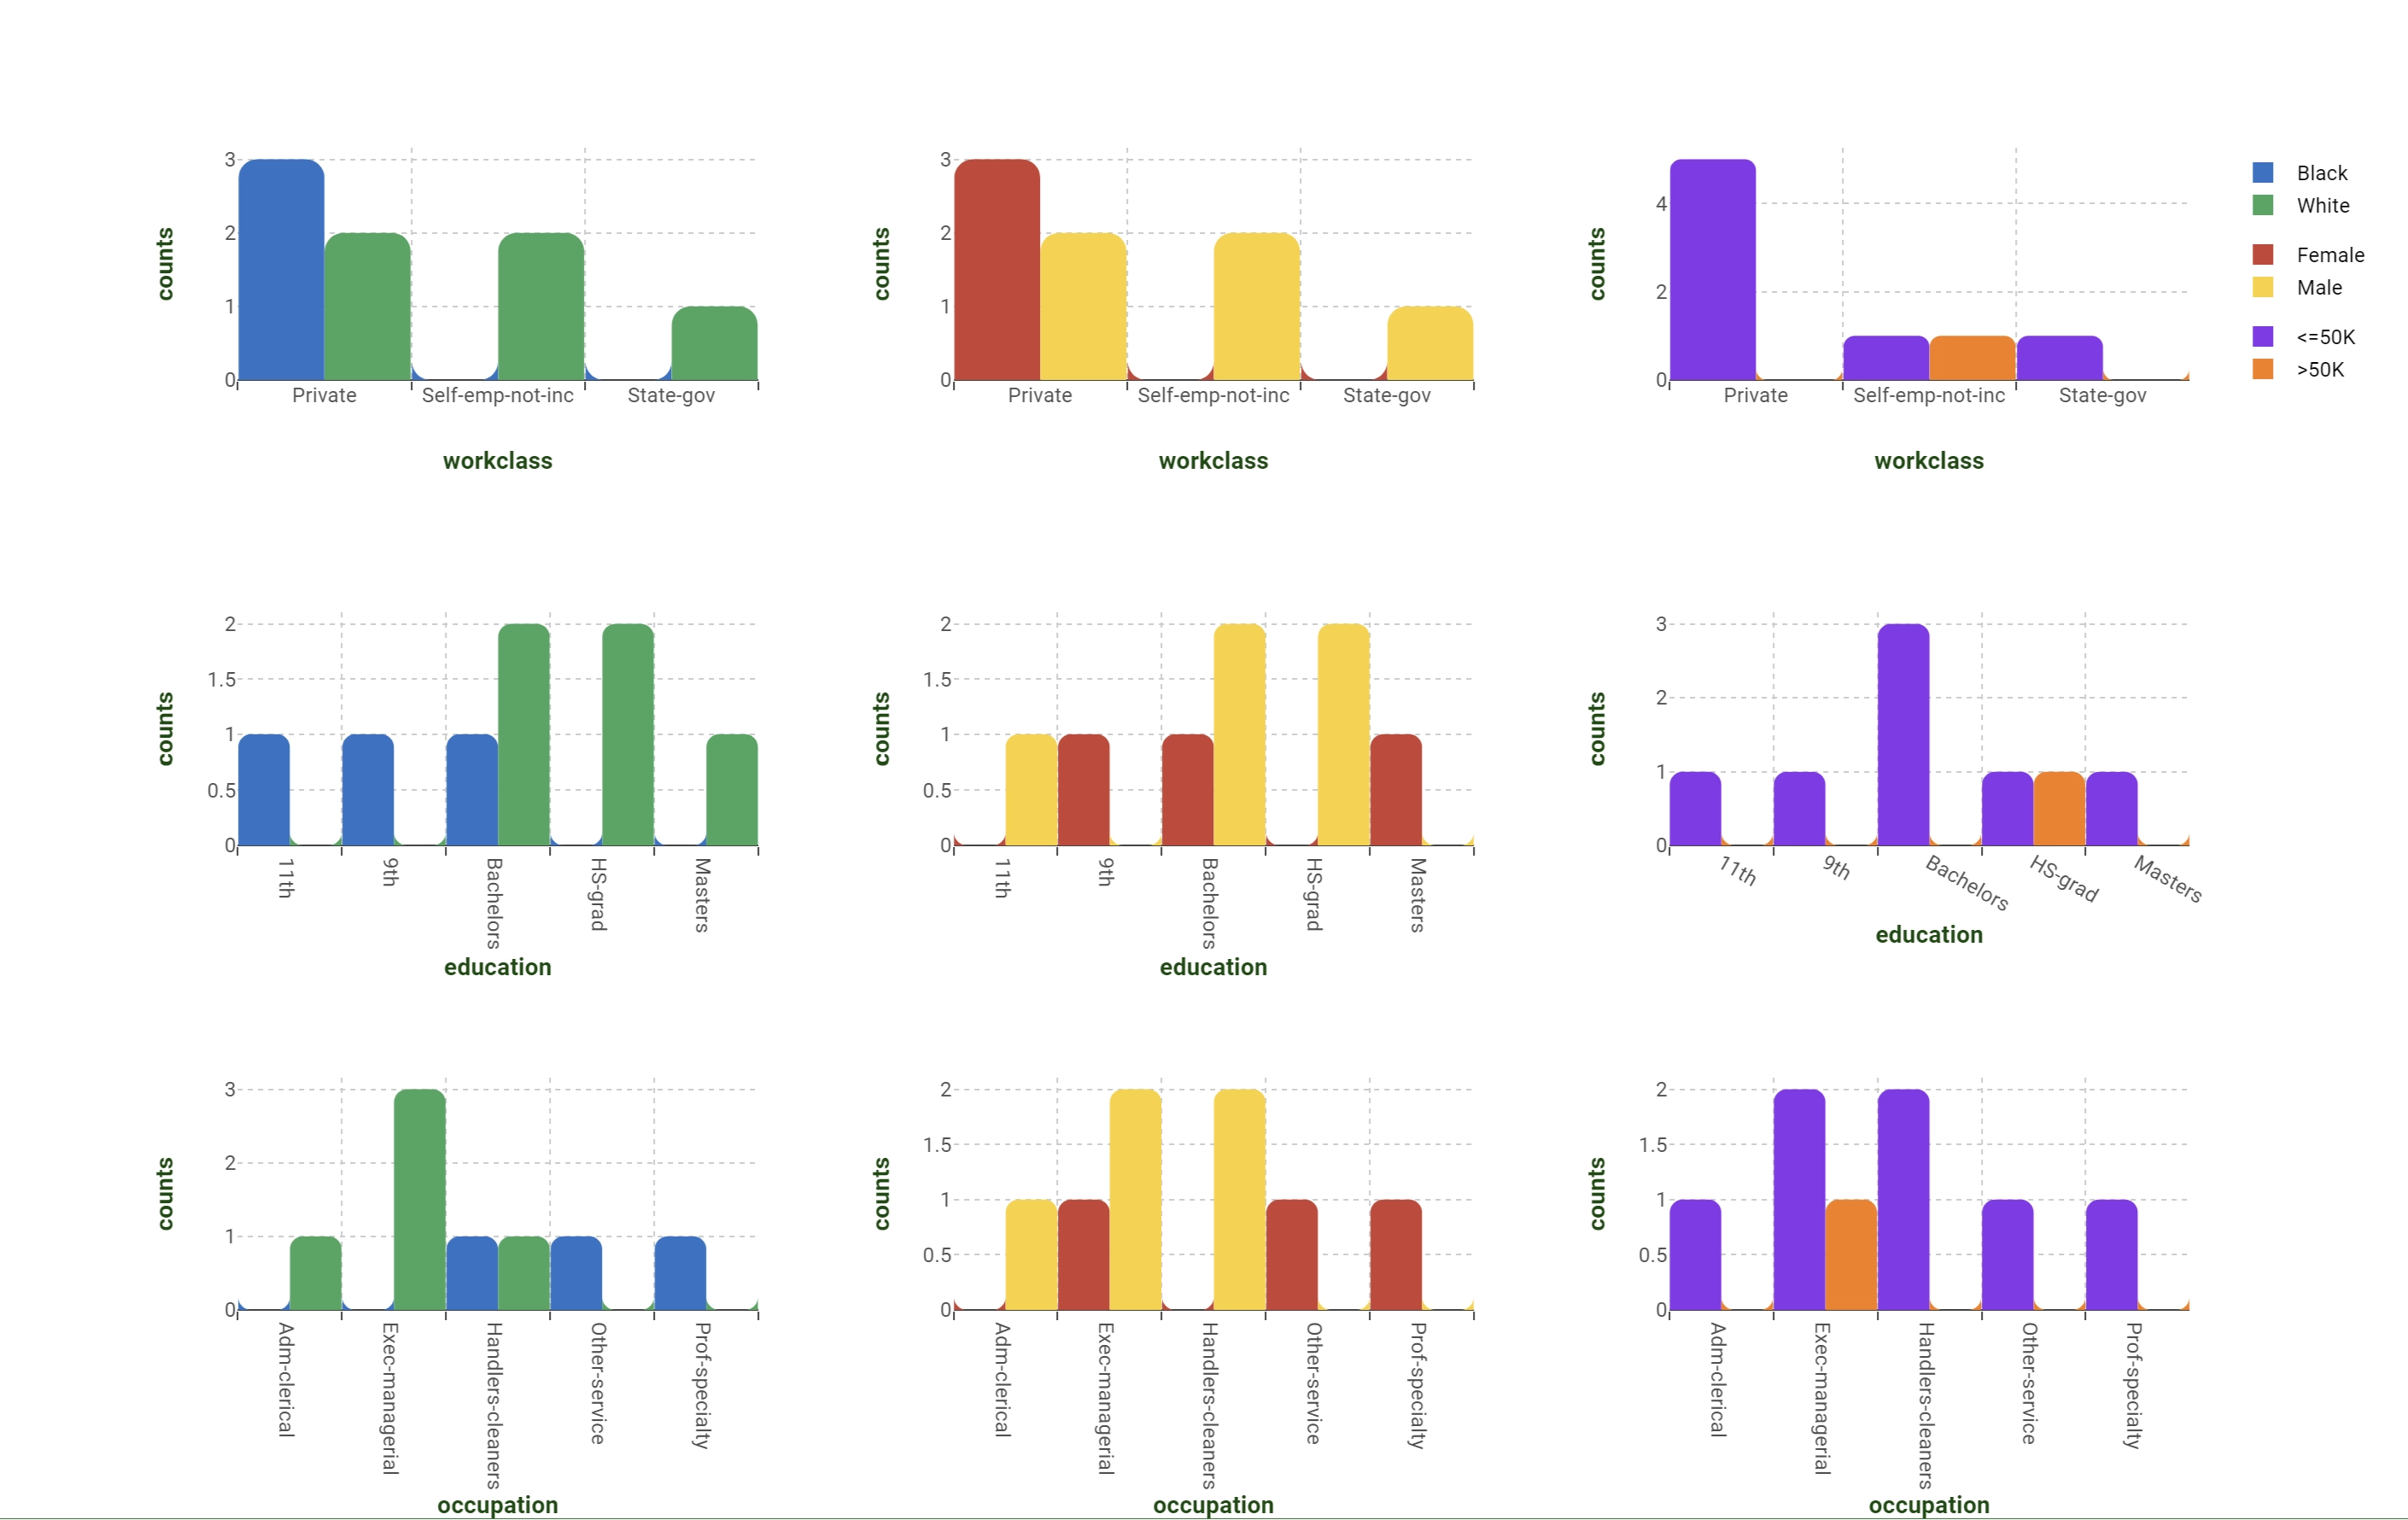
It can be oriented vertically and horizontally. In the table below, general characteristics for the vertical bar (Bar plot on the Factory’s interface) plot are displayed. The horizontal bar plot (Hbar Plot on the Factory’s interface) is described in this section.
Dimension (mandatory fields are in bold) |
Type |
Description |
|---|---|---|
X |
axis/grid |
It controls the attribute to be visualized on the x-axis. |
Y |
output |
It controls the output which allows the evaluation of bar heights. |
Color |
target |
It controls the color of the generated traces. |
Horizontal bar plot
The Hbar Plot is available as a separate plot type, which needs to be chosen by left-clicking on the Plot Type button.
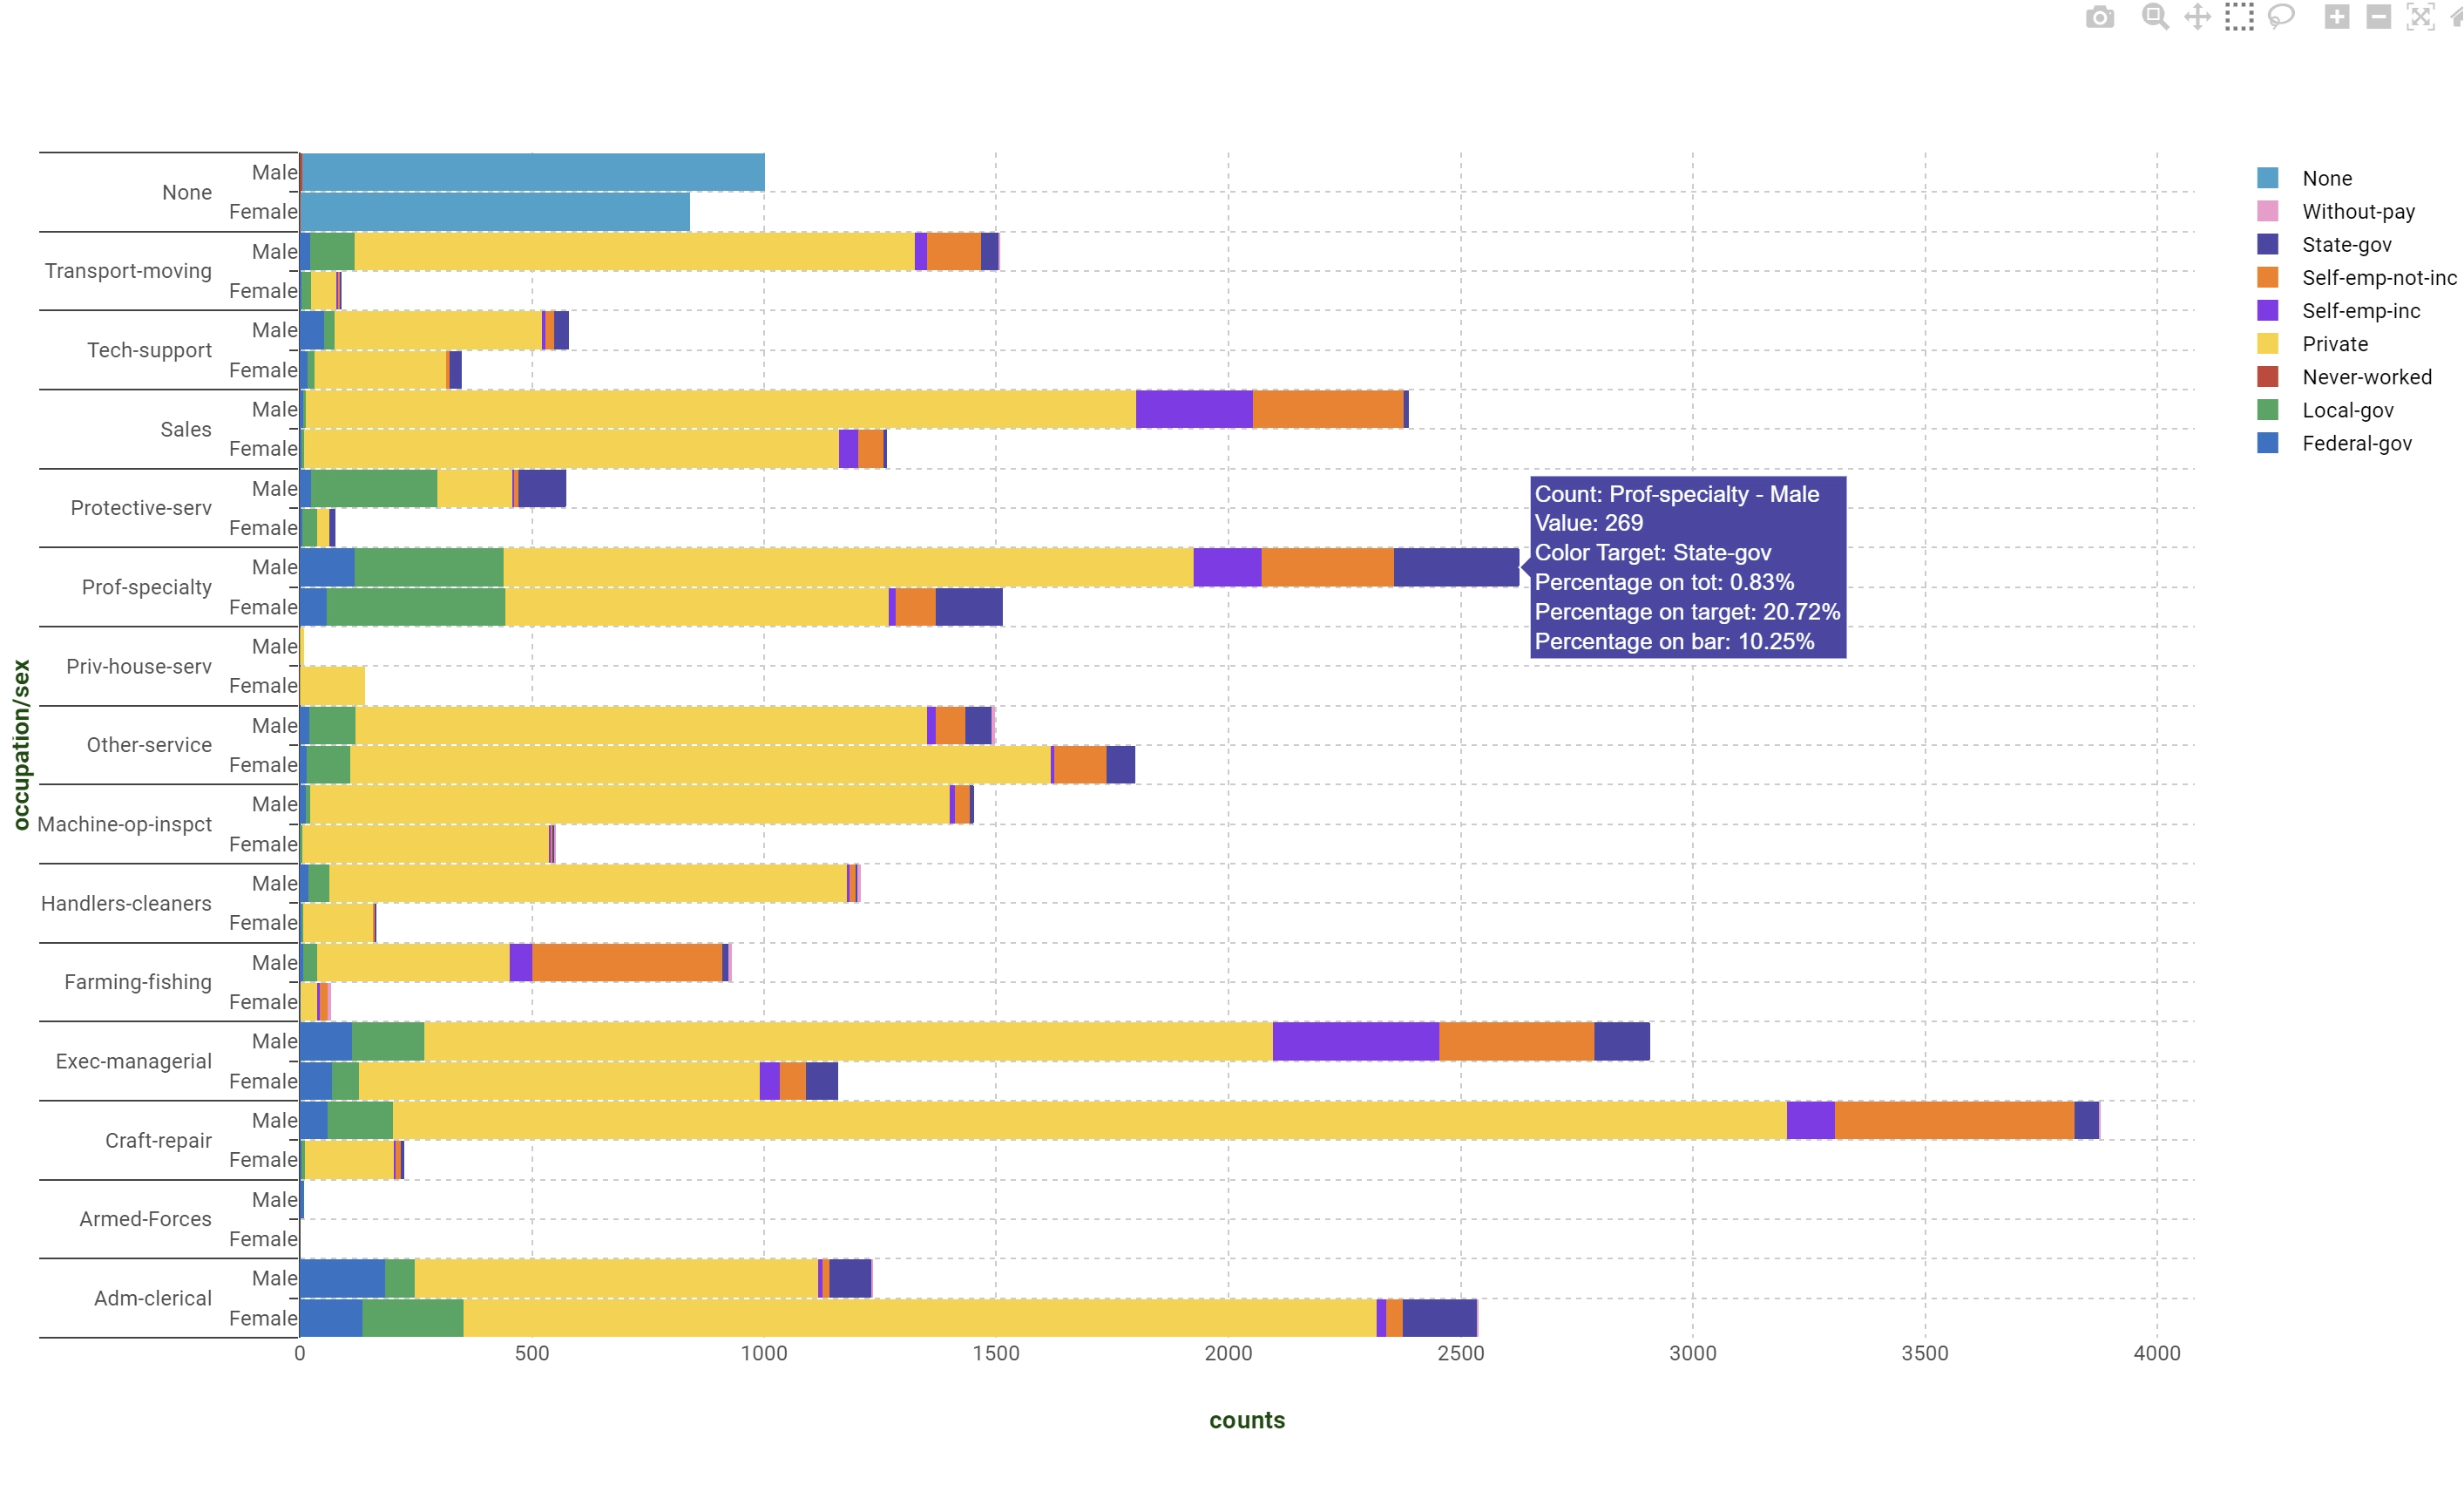
Compared to the Bar Plot (the vertical one), the only difference is the switch between X and Y dimensions.
Dimension |
Type |
Description |
|---|---|---|
X |
output |
It controls the output which allows the evaluation of bar widths. |
Y |
axis/grid |
It controls the distribution of points/bars onto the y-axis. |
Color |
target |
It controls the color of the various created traces. |