The Data tab
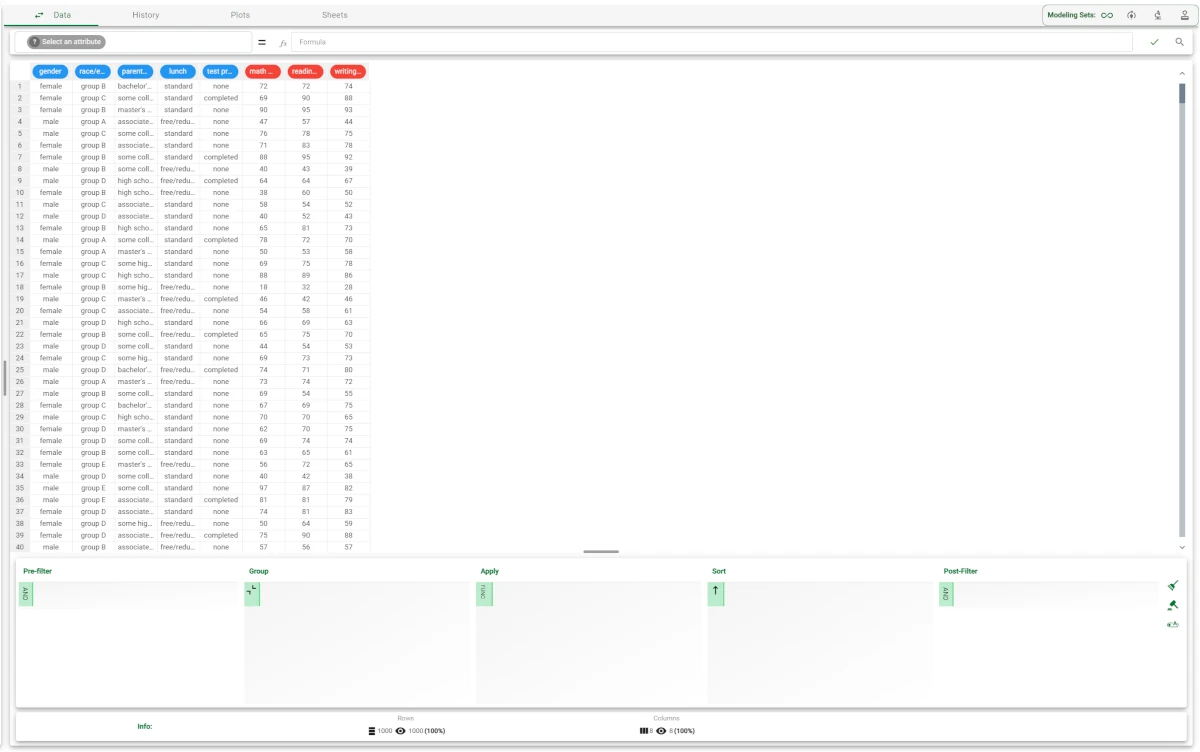
The Data tab in the Data Manager task displays the dataset in a spreadsheet format.
Next to the Data tab, there’s a double arrow icon which allows the user to switch from the data view to the attribute view. Here’s the page about the Attributes tab.
The main data pane is organized in four different areas, from top to bottom:
The formula bar
The main spreadsheet
The query panel
The info bar
Executing a formula
The formula bar allows users to execute functions or procedures on the columns of the dataset. The formula is divided in two different areas:
Left area: it contains the name of the attribute which will be defined by the formula.
Right area: it contains the formula which will define the attribute selected in the left area.
The formulas in the right area must follow the syntax rules of the underlying GOLD language. The main rules and operators about this language which are necessary to write complex formula are presented here.
To define the left area of your operation you can:
Click on a spreadsheet column (both on the header or on any cell of the grid) to automatically fill the left area of the formula bar. The right area will be filled with the latest executed formula, if any.
Click directly on the attribute drop down menu and select the desired attribute.
Hint
In the left area of the formula bar, by interacting directly with the attribute drop down menu you can insert two custom placeholders, leading to some particular behavior of the formula execution:
If you write
$namesin the left area, then the formula defined in the right area will be applied to the list of header names. This allows you to transform in bulk the names of the columns. Similar operations can be performed in the attribute view. This possibility can be considered as a shortcut to avoid switching to the attribute view. Further information are available below.If you write
$nullin the left area, you can execute a formula which does not return anything since this placeholder means your formula has no left term. This is useful for example to raise warnings or errors through the errorGold.
When clicking on the right area of the formula bar, its edge is highlighted, and the cursor is blinking to allow you to write the formula text. Some shortcuts are available:
By clicking on a spreadsheet column (both on the header or on any cell of the visible grid) its corresponding formula value
$"<column-name>"will be inserted in the text area next to the blinking position cursor. The cursor is then moved accordingly. Using Ctrl+Shift during clicking operation allows you to create more complicated lists of attributes, for example($"<column-name-1>", $"<column-name-2>", ...)or($"<column-name-1>":$"<column-name-2>").By dropping an attribute or a list of attributes from the Attribute list to the formula bar. Their corresponding formula value
$"<column-name>"will be inserted in the text area next to the blinking position cursor. The cursor is then moved accordingly.- Autocompletion is available during your formula typing:
Possible functions are suggested any time you start writing a new value not enclosed in quotes.
Possible attributes or results are suggested any time you start typing
$.
To deselect the right area of the formula bar, you need to click any point outside the whole Data view, for example on the Attribute list panel.
In formulas, you can also use variables. This @ is the prefix needed to use variables in a formula bar. For example, @Today could be a variable that contains the current date.
See also
When typing formulas, you can visualize hints of the complete formula and its parameters under the formula bar through a MONACO editor.
Between the left and the right areas, there’s the Formula icon. Clicking on it enables the user to open the Functions Menu.
The formula bar supports also a whole list of operators inherited directly from the GOLD language which is the underlying code of the whole Platform: more information about this language, its syntax and its operators is present in this section.
The use of operators in the formula bar and in the Data Manager formulas is described more in detail here.
Important
When using functions in formulas, pay close attention to the following syntax:
Function names are case-sensitive.
When specifying the attributes, the syntax is
$"attributename"When specifying a string, the syntax is
'string'When specifying continuous and integer values, just type them.
Strings can contain any characters, but must always be enclosed with the symbol
". For example,"sales".Variable names can contain letters (capital and lower-case), numbers and underscore only.
If you need to select more than one attribute at a time, you can press the Ctrl key and select all the required attributes:
($"att1", $"att5", $"att11")If you need to select a range of attributes, you can either press Shift and select the first and last attribute in the range, or press Shift and select them all with the cursor. The formula bar will include a colon to indicate the range:
($"att1":$"att5").
Examples of multiple selection syntax:.
* $"att_sum" = sum($"att1",$"att5", $"att11")
* $"att_sum" = sum($"att1":$"att5")
In the right area of the formula bar, you can find:
the tick-shaped icon: it launches the execution of the formula. The same result can be obtained by pressing Enter.
the magnifier icon: it performs a text search. Please refer to the searching for a text section to know how to use it.
To execute a formula, follow the procedure below:
Procedure
- Select the attribute you want to define in the left area of the formula bar in one of the following ways:
select an existing attribute from the left area drop-down menu
click on a cell in the spreadsheet
- Create the formula which will define the attribute in the right area, by:
entering attributes
entering constants
Press Enter or click the tick-shaped icon.
Bulk editing attributes’ headers with the $names parameters
If you need to edit the attribute headers, and apply to them a certain naming rule, you can define the $names parameter in the left area of the formula bar.
In this way, you can write a function which applies to all attributes.
For example, if you need to change a separator in the attribute headers, you can combine different Rulex functions together.
Example
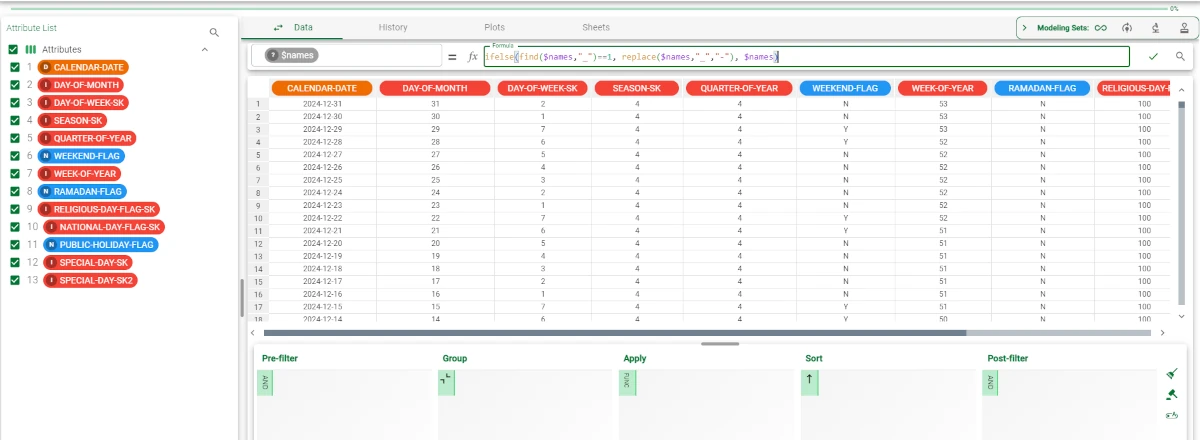
In this example, the ifelse, find and replace functions have been combined. In the Turkish calendar dataset, the __ header separator must be switched to -. Follow the steps listed below:
Write
$namesin the left-hand side area of the formula bar.Type the following function:
ifelse(find($names,"_")==1, replace($names,"_","-"), $names)in the right area of the formula bar.Press Enter or click on the green tick at the right-end of the formula bar to visualize the results. The results are shown below:
Searching for a text
By clicking on the magnifier icon located at the end of the formula bar, you can search a specific text string into the grid.
After clicking on the magnifier icon, a search menu opens, and you can customize your search operation:
Search text: it allows you to insert the text to search for.
Search type: you can select the type of searching criteria to apply. Possible values are:
Include: it considers any cell containing the searched text.
Match: it considers only cells containing the exact searched text.
Starts with: it considers only cells starting with the searched text.
Ends with: it considers only cells ending with the searched text.
Does not include: it considers only cells not containing the searched text.
Does not match: it considers only cells different from the searched text.
Does not start with: it considers only cells not starting with the searched text.
Does not end with: it considers only cells not ending with the searched text.
Search by column: it changes the scanning direction from the default left to right row by row, to top to bottom column by column.
Case sensitive: if selected, the Search type check is performed in case-sensitive mode.
Direction: it defines if next occurrence will be searched for before the current one (Up value) or after the current one (Down value).
Procedure
Click on the magnifier icon located at the right end of the formula bar.
Type in the Search text field the text to be searched.
Control search direction by selecting the Search by column checkbox or Direction.
Click the Find next button to highlight on the spreadsheet the next occurrence, or click Close to end the search operation.
The main spreadsheet
The central area of the whole Data Manager task is the main spreadsheet where data contained in the dataset are presented in a spreadsheet format.
If the number of rows or columns of the whole table is greater than the current viewport, a set of horizontal and vertical scrollbar will appear to permit you to navigate the table.
Note
To easily navigate through the spreadsheet using the scrollbar you can:
Use your mouse wheel to scroll in vertical direction (or horizontal by pressing Shift and interacting with the mouse wheel). Each wheel step corresponds to a one row/column shift.
Click on the scrollbar track to move in vertical or horizontal direction of an entire viewport page.
Spreadsheet visualization is mainly divided into three parts:
Index column: where row indexes are displayed.
Header row: where attribute names and types are presented.
Main grid: containing the actual values of the dataset in a grid shape.
By clicking on any of these three sectors you can highlight a subset of the dataset. Multiple selection can be combined with the usual Ctrl or Shift + click procedure. The selection is used in most of the operations triggered from the various context menus which can opened from the main spreadsheet.
By double-clicking the attributes header, you will automatically resize its column according to the visualized content. Width resizing for columns, and height resizing for rows can be gradually changed by moving the right end of the header cell or the bottom end of the index cell with the mouse pointer.
Editing a cell
To start the manual editing of a cell you can:
Double-clicking on it.
Select it and start typing.
Note
Even if both these operations will start the editing operation, there is a substantial difference between these two:
when you double-click on a cell, the value already present will be maintained and the cursor will appear blinking at the end of the old text.
when you start typing after a cell selection, any value already present in the cell will be erased as soon as you start typing.
Once you have finished your manual editing, you can use arrows or the Enter key to move to a contiguous cell (pressing Enter on your keyboard is equal to the down arrow) and continue your editing operation. Real value modifications can be triggered only when no input editing is performed on one of the cell or selection has been triggered by clicking on a different cell or location outside the scope.
A value modification triggers automatically a decideType operation on the considered column to change its type according to the new provided text.
The Query panel
In the query panel you can execute simple or complex SQL-like operations on your underlying dataset.
In particular, the query panel is divided into five areas, each of them controlling one of the base SQL-like operation:
Pre-filter: executing a WHERE clause operation as the first operation of your query execution. Its internal structure and its internal interactions are described in Filter section.
Group: executing a GROUP clause operation on the considered columns. Its internal structure and its internal interactions are described in Group section.
Apply: executing an APPLY clause operation on the considered columns. Aggregator function can be selected differently column by column. Its internal structure and its internal interactions are described in Apply section.
Sort: executing a SORT clause operation on the considered columns. Its internal structure and its internal interactions are described in Sort section.
Post-filter: executing a WHERE clause operation as the last operation of your query execution. Its internal structure and its internal interactions are described in Filter section.
The order of the operations is defined by the position of each area in the query panel. Query operations are executed from left to right in the displayed order.
Note
Pre-filter and Post-filter areas are conceptually equal, they only differs by their execution order.
On the right end of the query panel, some query buttons define the query panel execution. In particular:
Clear: it resets all the queries erasing all the attributes present in the five areas.
Make Persistent: it applies the queries by cutting off all the filtered lines and by reordering the whole dataset. All the attributes present in the five areas are erased, and the previously defined queries are applied.
Auto commit: it is a two-state button. By default, it is turned on, once defined the query, it is immediately executed on the dataset loaded in memory, and an updated version is displayed. Otherwise, if you click on it and turn it off, the query is executed only after clicking the Play button.
Play: it is present only if the Auto commit button is turned off. It starts the execution of the provided query on the dataset loaded in memory.
The Info bar
In the Info bar, you’ll find some general information about the dataset and the selected column. In particular, in the first section of the bar, you’ll always find:
The total number of rows
The number of rows displayed, after performing filtering and grouping operations in the query panel.
The total number of columns
The number of columns displayed, after performing filtering and selection operations in the Attribute list.
If a column with output role and a column with prediction role sharing the same output name is present, in second section of the bar you can find:
Information about Correct Classification: in case of machine learning classification.
Information about Standard Error and Novelty: in case of machine learning regression.
The right-end side of the Info bar, displays values only after a command; indeed the right-end side of the Info bar contains some statistics about the selected feature. In particular, the Info bar displays the following values according to the last selected column:
Minimum (ordered)
Maximum (ordered)
Sum (ordered)
Mean (ordered)
Std. Dev. (ordered)
N. missing (ordered and nominal)
Mode (nominal)
N. distinct. (nominal)
- Executing queries
- Data Manager functions
- The Attributes tab
- Styling dataset columns