Apply Model
The Apply Model task applies the models generated by classification, regression and clustering tasks to new datasets.
It is normally made of two tabs:
the Options tab
the Results tab
The Options tab
The Options tab contains all the options to customize how the created model can be applied to new data. The available options and the task’s layout vary according to the generated model.
The first panel, located on top of the screen, has the same layout in all the occurrences, and contains the following options:
- Available models: select the currently available input you want to apply from the drop-down list. The possible options are:
Rules (LLM and Decision Tree tasks)
Models (Regression tasks)
Clusters (Clustering tasks)
Save confusion matrix (if available): if selected, the confusion matrix is saved in the execution information of the task. This information is displayed in the Results tab of the computed task. As this may result in a large amount of data, it may be preferable not to save it.
Use output to index previous clustering: if selected, both rules and clusters will be applied, when applicable. Consequently, when rules are applied the characteristics of clusters associated to the rule output are added (for example, the centroid of cluster 7 is added to rule 7).
Append results: if selected, the results of the current computation are appended to the dataset, otherwise they replace the results of the previous computations.
Model generated by classification tasks
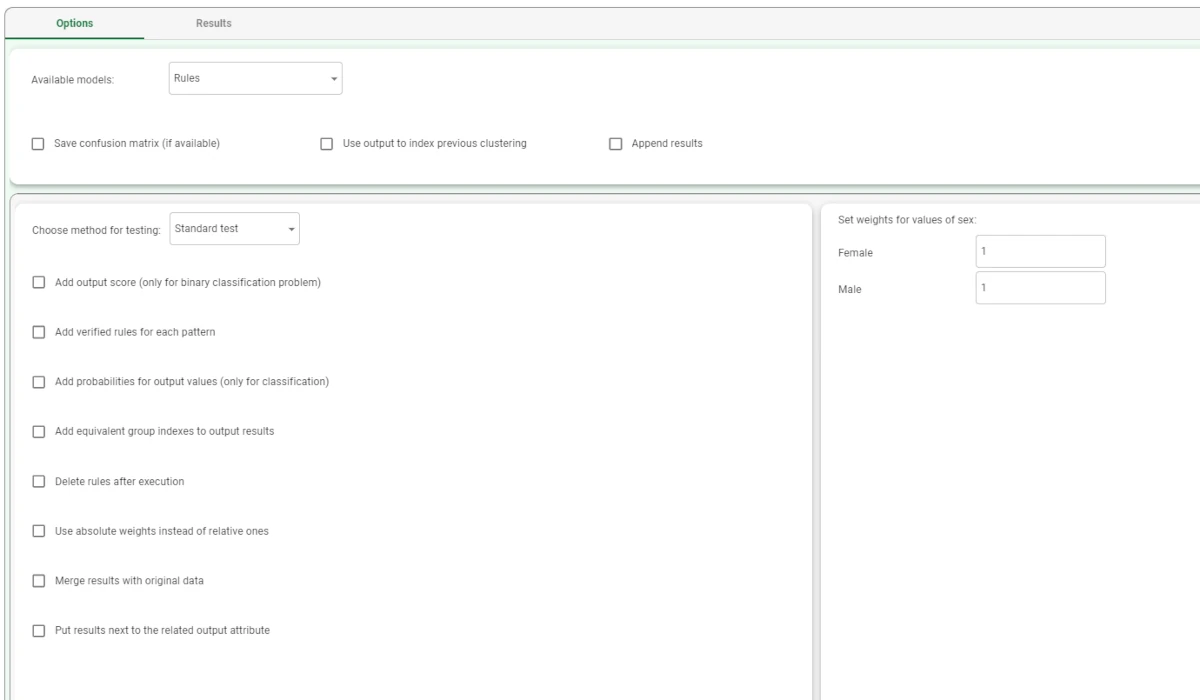
When the Apply Model task is linked to a classification task, two panes are added to the model panel: the first one, located at the bottom-left part of the screen, contains the testing methods and their settings, while the second one, located at the bottom-right part of the screen, contains the options to set the weights for the output(s) of the classification task.
The options available in the model settings area are:
Available models: select the currently available input you want to apply from the drop-down list. The possible option for classification tasks is Rules.
Save confusion matrix (if available): if selected, the confusion matrix is saved in the execution information of the task. This information is displayed in the Results tab of the computed task. As this may result in a large amount of data, it may be preferable not to save it.
Use output to index previous clustering: if selected, both rules and clusters will be applied, when applicable. Consequently, when rules are applied the characteristics of clusters associated to the rule output are added (for example, the centroid of cluster 7 is added to rule 7).
Append results: if selected, the results of the current computation are appended to the dataset, otherwise they replace the results of the previous computations.
The options available in the testing method area are:
- Choose method for testing: select how to apply rules to the data. The possible values are:
Standard test: one output value is considered at a time and all the relevances of the rules pertaining to that value and satisfied by the input pattern are summed; the relevance values obtained are then compared, and the output associated with the greatest is assigned to the pattern.
Modified test: it is similar to the standard test, but it also considers a relevance measure for each single condition in the rules satisfied by the input pattern.
AND-OR test: rules are listed according to their relevance, then the output associated with the first rule which covers the input pattern is assigned to it.
Add output score (only for binary classification problem): if selected, a column is added, with a continuous value between -1 and +1, which represents the precision of the classification. For example, if the class “true” is +1, a score of 0.99 means the output almost certainly belongs to the class “true”.
Add verified rules for each pattern: if selected, all verified rules are displayed, instead of the most important rule only.
Add probabilities for output values (only for classification): if selected, a column is added, with a probability the precision of the class classification.
Add equivalent group indexes to output results: if selected, the index of the ambiguity group is added. An ambiguity group is a group of rows with the same input value.
Delete rules after execution: if selected, rules are deleted after they are applied. This is useful when you want to apply the rules once only.
Use absolute weights instead of relative ones: if selected, the frequency of the class within the training set is considered when calculating the weight associated with each rule.
Merge results with original data: if selected, once applied the attributes and results are saved in the same structure.
Put results next to the related output attribute: if selected, the results of each attribute are displayed next to the attribute itself. This option is available only if you have selected the previous option to merge results with previous data.
Model generated by regression tasks
When the Apply Model task is linked to a regression task, the task contains the model panel only.
Model generated by clustering tasks
When the Apply Model task is linked to a clustering task, the task contains the model panel and another panel, where the following options can be set:
- Distance method for evaluation: select the method required for distance, from the possible values: (more information on the values below can be found at the corresponding page)
Euclidean
Euclidean (normalized)
Manhattan
Manhattan (normalized)
Pearson
Replace output after forecast: if selected, during the execution the Apply Model task searches for a Cluster id column and turns it into an Output. Each row of this column is then filled with the index value of the corresponding cluster.
Use distance between profiles in Label Clustering: applies label clustering using profiles instead of labels, as if it was being a normal clustering system.
The Results tab
As the task’s settings vary according to the input they receive. So, also the results shown in this tab vary according to the input it receives.
It is divided into two panes: the General Info and the Result Quantities panels.
In the General Info panel, the following information is provided, no matter which input they receive:
Task Label: the task’s name on the interface.
Elapsed time (sec): it indicates how long it took to complete the computation.
The Result Quantities panel provides detailed result quantities, and the results shown vary according to the input received.
You can check or uncheck the quantities above to visualize them in the results list. You can visualize their specific values by clicking on the arrow next to them.
Note
For each result quantities, the results are divided in four groups: the Train, Test, Valid and Whole groups, containing the corresponding counts.
Result Quantities for classification tasks
The Result Quantities provided by the Apply Model task when it is linked to a classification task are the following:
Accuracy
Correctness(%)
Coverage
F-measure
Matthews correlation coefficient
Negative predictive value | Negative reliability
Novelty
Number of samples
Precision | Positive predictive value
Relative negative reliability
Relative precision
Relative sensitivity
Relative specificity
Samples not covered by rules
Satisfaction
Sensitivity | Recall | True positive rate
Specificity | True negative rate
Support | Frequency
Total number of samples for each class
Result Quantities for regression tasks
The Result Quantities provided by the Apply Model task when it is linked to a regression task are the following:
Error on data samples
Number of samples
Relative error on training samples
Result Quantities for clustering tasks
The Result Quantities provided by the Apply Model task when it is linked to a clustering task are the following:
Davies-Bouldin index
Error on data samples
Error on remaining samples
Error on samples leading to a proper cluster
Number of clusters
Number of remaining samples
Number of samples
Number of samples leading to a proper cluster
PseudoF index (Calinski-Harabasz criterion)
Relative PseudoF index
Example
In this example, an LLM classification task has been used to generate rules.
Add an Apply Model task to the flow and link it to the LLM classification task.
Double-click the task to open it and leave the default settings.
Save and compute the task.
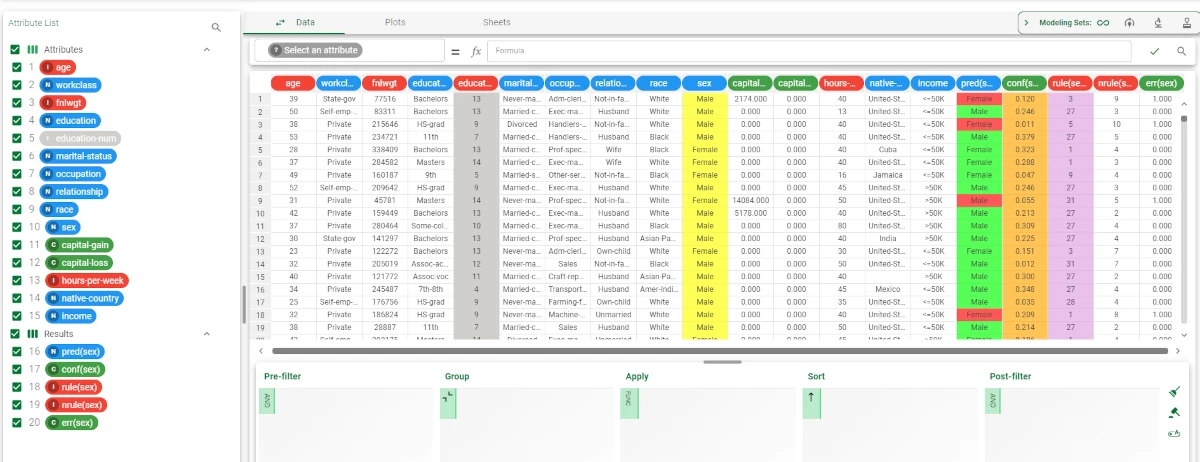
Right-click on the Apply Model task and select Take a look. Alternatively, you can add a Data Manager to the flow and link it to the Apply Model task.
The model has been applied to the source data, and new columns are added, according to the analysis performed.