Linear
The Linear Regression task solves regression problems where the output value is estimated to be a linear combination of the input variables using the Ordinary Least Squares (OLS) method.
The Linear regression task is divided into three tabs:
The Options Tab, where users can choose the attribute they will work on and with.
The Coefficients Tab, where users can see a visual representation in a spreadsheet format of the coefficients generated by the analysis.
The Results Tab, where users can visualize a summary of the computation.
The Options tab
The Options tab presents the following structure:
Available attributes, where users will find the dataset’s attributes. It is always displayed on both Basic and Advanced tabs.
Attributes drop area, where users can drag the chosen attributes.
One Customization pane, where users are able to customize different options.
Available Attributes
Within this section, users will find a list of all the dataset’s attributes. To search for a specific attribute, use the lens icon at the top right of the panel.
Users also have the option of sorting the attributes according to their preferences.
They can choose from a drop-down list of the Order by option:
Attribute
Name
Type
Ignored
Role
Attributes Drop Area
The Attribute drop area is divided into two panes:
The Input attributes, where users can drag and drop the input attributes they want to use to create rules for classifying data. This operation can be done via a Manual List (users need to manually drag & drop the selected attributes onto the pane) or via a filtered list.
The Output attributes, where users can drag and drop the attributes they want to use to form the final classes into which the dataset will be divided. This operation can be done via a Manual List (users need to manually drag & drop the selected attributes onto the pane) or via a filtered list.
Customization Pane
Within this pane, users can customize the available options, which are:
Normalization for input attributes. The type of normalization to use when treating ordered (discrete or continuous) variables. Available options are:
None
Attribute
Normal
Minmax [0.1]
Minmax [-1,1]
Normalization for output attributes. Select which method should be adopted to normalize output variables. Available options are:
None
Attribute
Normal
Minmax [0.1]
Minmax [-1,1]
P-value confidence (%). Users can set the value of the confidence coefficient.
Weight attribute. The attribute that represents the relevance (weight) of each sample.
Regularization parameter. The value of the regularization parameter that is added to the diagonal of the matrix.
Initialize random generator with seed. If selected, a seed is used to set the starting point in the sequence during random generation operations. Therefore, using the same seed each time will make each execution reproducible. Otherwise, running the same task (with identical options) may produce different outcomes due to different random numbers being generated at some stages of the process.
Aggregate data before processing. If selected, identical patterns are aggregated and considered as a single pattern during the training phase.
Append results. If selected, the results of this computation are appended to the dataset, otherwise they replace the results of previous computations.
Set value for constant term. Users can enter a value, which will be used to compute coefficients.
Value for constant term. If the checkbox Set value for constant term has been selected, users can set a value for the constant term which will be used to compute the coefficient.
The Coefficients tab
This tab gives users a visual representation in a spreadsheet format of the coefficients generated by the analysis.
The Results tab
Within this tab, users can visualize a summary of the computation.
This tab is divided into two panes:
General Info
Within this pane, users can find the following information:
Task label
Elapsed time
Number of input attributes
Maximum coefficient (absolute value)
None
Result Quantities
Within this pane, users can set and configure the following options:
Number of samples
This checkbox is checked by default.
On the right of the above-mentioned checkbox, users, through a drop-down list, will be able to choose between the following options:
Train
Test
Valid
Whole
Example
After having imported the dataset, split the dataset into test and training sets (add 30% test and 70% training) with the Split Data task.
Then, add a Linear task.
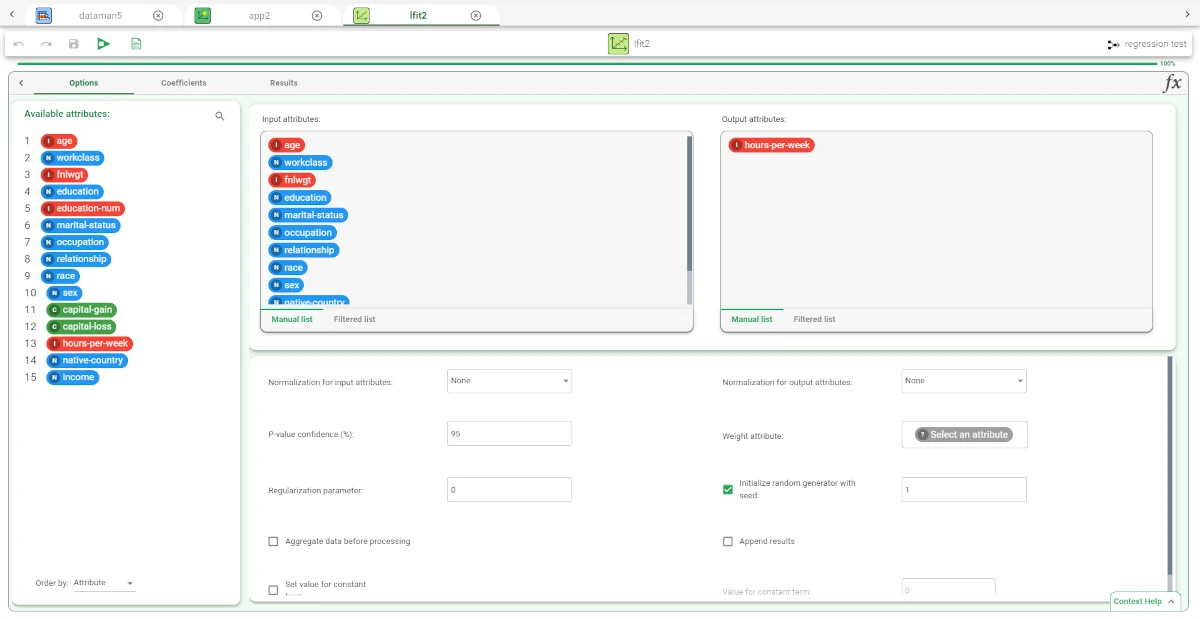
Specify the following attributes:
set the attribute hours-per-week as output attribute.
set all the other attributes - except for income - as input attributes.
Save and compute the task.
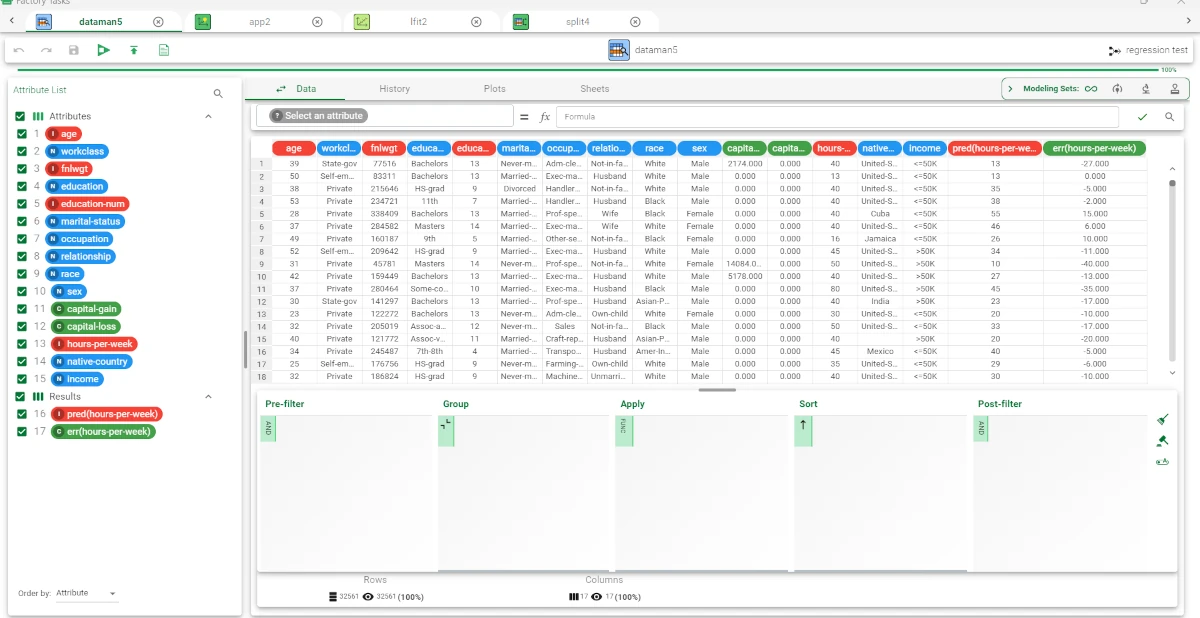
Add an Apply Model task to visualize the results.
Add a Data Manger to the flow to visualize and check how the model built has been applied to the dataset.
Two more columns have been added by the Apply Model task:
The pred(hours-per-week) column contains the output forecast.
The err(hours-per-week) column contains the error.