Feature Ranking
The Feature Ranking task provides a graphical representation of the importance of attributes within a class (attribute ranking) and the values within specific attributes (value ranking).
Feature Ranking layout
The Feature Ranking task is divided into three panes:
The Attributes pane, where users can configure different options related to attributes.
The Customization pane, where users can customize different options.
The Visualization pane, where users can see a graphic visualization of the attributes according to different parameters.
Attributes pane
Within this pane, users can visualize some information and configure different attributes options.
This pane is divided itself into two sections:
Rules Attributes Within this section, users can visualize the attributes present in the rules for each class, ordered according to the Order attributes by option. The attribute selected here will determine which attribute is displayed in the Value Ranking plot.
Displayed Relevances Users can decide whether they want to display plots that refer to:
all possible output values (Absolute)
to a single class (Relative).
Customization pane
Within this pane, users can set the following options:
Enable multi plot: if selected, a plot is displayed for each relevance selected in the Displayed Relevances options. This option is only available for nominal output values.
Order values by: users can select the criterion for sorting the values of each attribute.
Possible choices are by:
Relevance
Value (ascending order for numerical attributes, or alphabetical for nominal attributes). This option is applied to the Value Ranking plot.
Visualization pane
This pane is divided itself into two tabs:
The Attribute ranking tab, where users are able to see a graphic visualization of the importance of attributes within a class.
Within this tab, users are provided with a graphic visualization of the importance of attributes within a class. A bar plot displays values at the end of each bar.
By hovering on the plot, users will find the following interactive icons:
Download plot as a png
Zoom
Pan
Box select
Lasso select
Zoom in
Zoom out
Autoscale
Reset axes
For more information about the above-mentioned plots, please refer to the Data Manager page.
The Value ranking tab, where users are able to see a graphic visualization of the values within specific attributes Within this tab, users are provided with a graphic visualization of the values within specific attributes. A bar plot displays values at the end of each bar.
By hovering over the previously mentioned matrix, users will find the following customized plot visualization:
Download plot as a png
Zoom
Pan
Box select
Lasso select
Zoom in
Zoom out
Autoscale
Reset axes
For more information about the above-mentioned plots, please refer to the Data Manager page.
Example
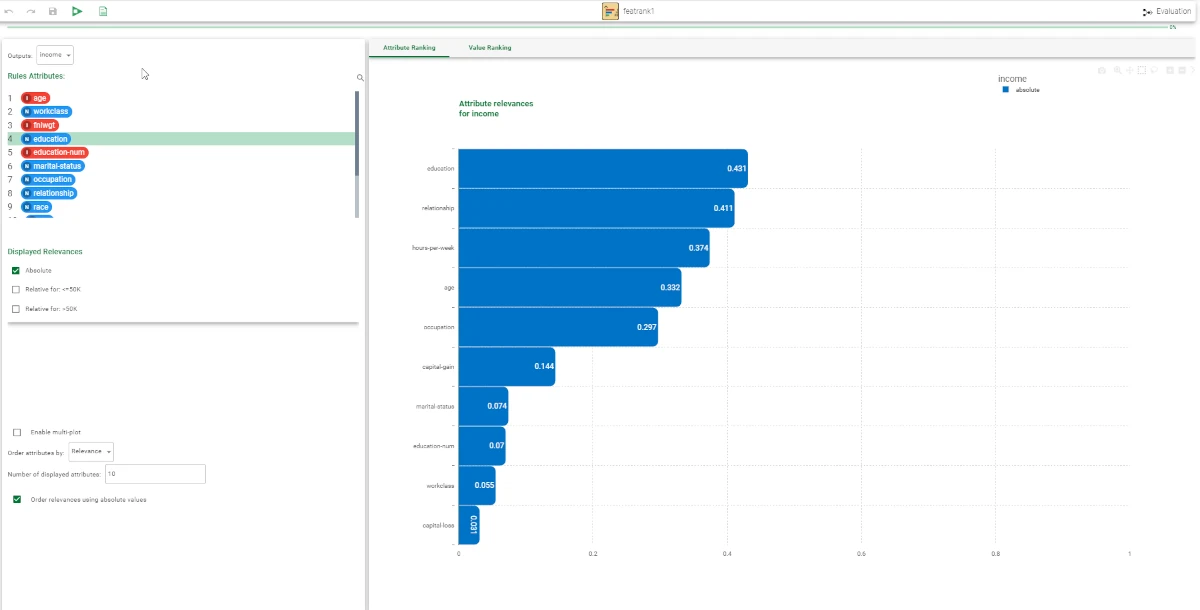
After having imported the dataset with the Import from Text File task, split the dataset into test and training sets (30% test and 70% training) with the Split Data task. Then, add a LLM Classification task to the flow, specifying the Income attribute as Output. Save and compute the task. Add a Feature Ranking task and open it.

The plot includes 14 attributes. The Attribute Ranking plot clearly shows that the education variable is the most important attribute in determining output.
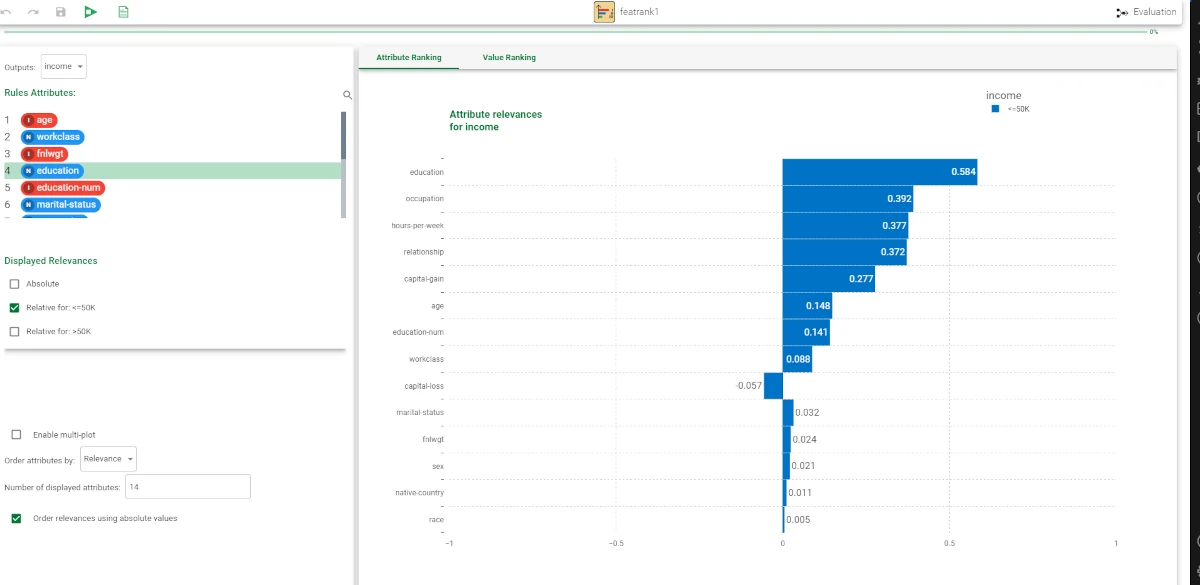
If users choose to display only the attributes associated with an output <=50K, the plot changes significantly and includes negative values, indicating that the attribute is inversely correlated with that output. In case the Order by Absolute values checkbox is selected, the attributes are sorted according to the absolute value of relevance.
Users can view the importance of each interval by clicking on the Value Ranking tab. In the example provided below, the relevance for the age attribute is shown in crescent order of importance.
