Optimize Ruleset
The Optimize Ruleset task allows to optimize an existing set of rules, and consequently to improve the generation of predictive rules through a series of constraints.
The task is divided into three tabs:
the Options tab
the Monitor tab
the Results tab
The Options tab
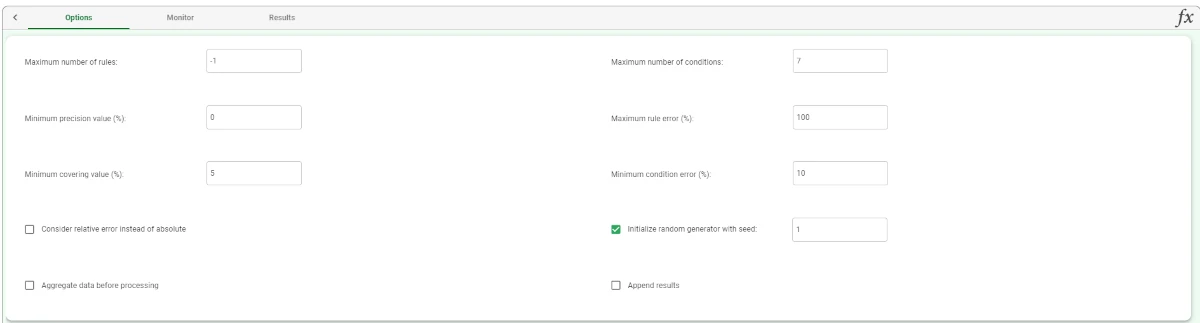
The Options tab contains all the available settings to customize the ruleset optimization operations. The following options are provided:
Maximum number of rules: specify the overall maximum number of rules for the dataset. By default, no limitations are imposed.
Maximum number of conditions: specify the maximum number of conditions that any rule in the final dataset can contain.
A lower threshold can improve the readability of rules. By default, no limitations are imposed.Minimum precision value (%): specify the minimum percentage of precision that a rule must have.
Precision is defined as the ratio between the number of patterns of the correct class covered by the rule and the total number of covered patterns.
A lower threshold can improve the quality of rules. By default, no limitations are imposed.Maximum rule error (%): specify the maximum error (in percentage) that a rule can score. The absolute or relative error is considered according to the whether the Consider relative error instead of absolute option is checked or not.
The error is defined as the ratio between the number of patterns belonging to an incorrect class, which are nonetheless covered by the rule and the total number of covered patterns.
A lower threshold can improve the accuracy of the rules. By default, no limitations are imposed.Minimum covering value (%): specify the minimum percentage of covering that each rule in the final dataset must have.
Covering is defined as the fraction of patterns belonging to the correct class that are covered by the rule.Minimum condition error (%): specify the minimum error value for each condition in each rule in the final dataset.
Consider relative error instead of absolute: specify whether the relative or absolute error must be considered.
- The Maximum error allowed for each rule is set by considering proportions of samples belonging to different classes. Imagine a scenario where for given rule pertaining to the specific output value yo:
TP is the number of true positives (samples with the output value yo that verify the conditions of the rule).
TN is the number of true negatives (samples with output values different from yo that do not verify the conditions of the rule).
FP is the number of false positives (samples with output values different from yo that do verify the conditions of the rule).
FN is the number of false negatives (samples with the output values yo that do not verify the conditions of the rule).
If checked, the relative error is considered in evaluating the maximum rule error and the minimum condition error. For example, if 10% is the maximum error allowed for a rule, this means that the error cannot be more than the 10% of the covering of the rule.
Initialize random generator with seed: if selected, a seed, which defines the starting point in the sequence, is used during random generation operations. Consequently, using the same seed each time will make each execution reproducible. Otherwise, each execution of the same task (with same options) may produce dissimilar results due to different random numbers being generated in some phases of the process.
Aggregate data before processing: if selected, identical patterns are aggregated and considered as a single pattern during the training phase.
Append results: if selected, the results of this computation are appended to the dataset, otherwise they replace the results of previous computations.
The Monitor tab
In the Monitor tab, users will find interactive histograms showing the generated rules: they are already displayed without computing the task, and they will update during and after the computation, according to the constraints set.
Moreover, it is possible to interact with the bar plots in the following ways:
Double-click on the color target: the corresponding bar is highlighted, all the other ones are greyed out.
Click on the color target: the corresponding bar is greyed out.
Click on the bar: the corresponding bar is highlighted, all the other ones are greyed out. By clicking again, the bar itself is greyed out.
Click on a greyed bar: the highlighted bar is greyed out.
Double-click on a greyed bar: all the bars are highlighted.
The Monitor tab is divided into three smaller tabs: the Conditions, the Covering, and the Error tabs.
Conditions tab
In the Conditions tab, a vertical bar plot displaying the conditions is provided.
Users will find the following information:
On the X axis, the number of conditions is displayed.
On the Y axis, the count of the generated rules is displayed.
On the Color target, which can be found at the right of the plot, the output’s values are displayed. By double-clicking on the output’s value, the plot displays the required information accordingly.
By hovering over the bars, basic information on them is displayed, which usually consists of the Count, Range, Color Value, Percentage on total, Percentage on target, Percentage on bar.
Covering tab
In the Covering tab, a vertical bar plot displaying the covering features is provided.
Users will find the following information:
On the X axis, the covering percentage is displayed.
On the Y axis, the count of the rules with the corresponding percentage of covering is displayed.
On the Color target, which can be found at the right of the plot, the output’s values are displayed. By double-clicking on the output’s value, the plot displays the required information accordingly.
By hovering over the bars, basic information on them is displayed, which generally consists of the Count, the Range, the Color value, the Percentage on total, the Percentage on target, and the Percentage on bar.
Error tab
In the Error tab, a vertical bar displaying the error features is provided.
Users will find the following information:
On the X axis, the error percentage is displayed.
On the Y axis, the count of the rules with the corresponding percentage of error is displayed.
On the Color target, which can be found at the right of the plot, the output’s values are displayed. By double-clicking on the output’s value, the plot displays the required information accordingly.
If you hover over the bars, you will find basic information on them, which generally consists of the Count, the Range, the Color value, the Percentage on total, the Percentage on target, and the Percentage on bar.
The Results tab
The Results tab provides information on the computation. It is divided into two sections:
- In the General info section, where general information on computation is provided as follows:
The Task Label, which is the task’s name on the interface.
The Elapsed time, which indicates how long it took to complete the computation
- the Result Quantities tab, where the following information can be found:
Average covering for a rule (%)
Average error for a rule
Average number of conditions in a rule
Maximum covering for a rule (%)
Maximum error for a rule
Maximum number of conditions in a rule
Minimum covering for a rule (%)
Minimum error for a rule
Minimum number of conditions in a rule
Number of attributes in rules
Number of distinct samples
Number of rules
Number of samples
You can check or uncheck the quantities above to visualize them in the results list. You can visualize their specific values by clicking on the arrow next to them.
Example
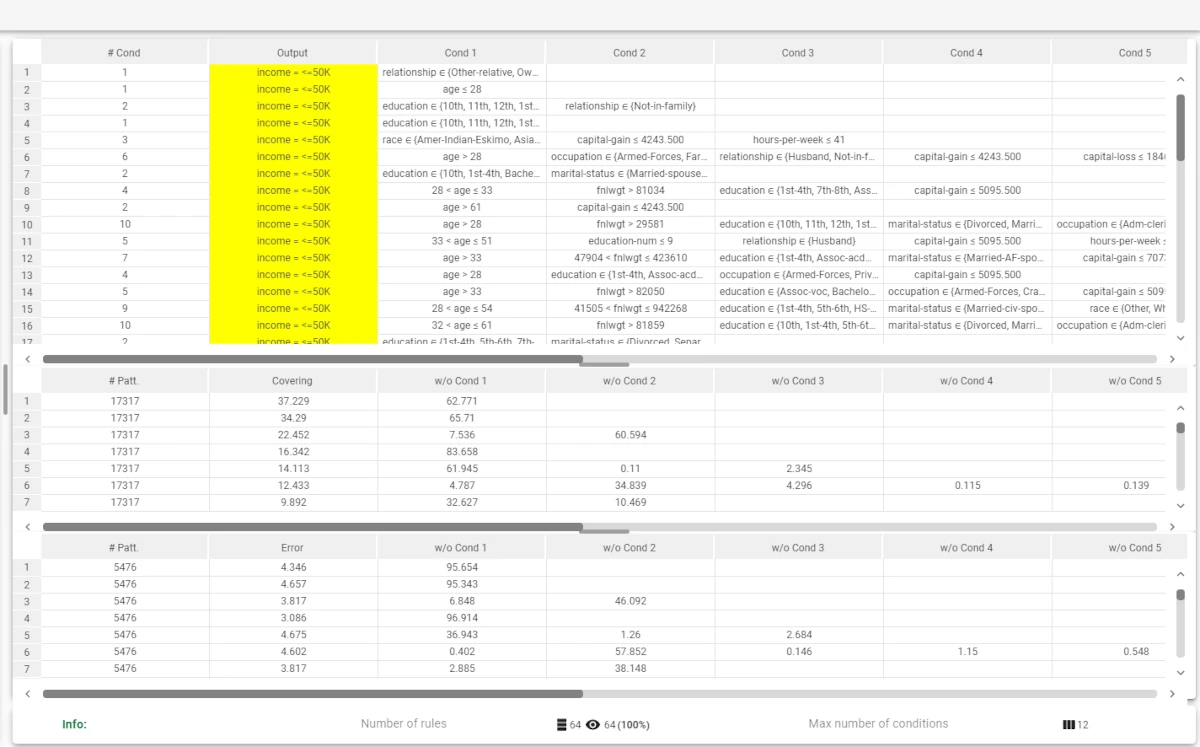
Import the file and configure the Split Data and LLM Classification tasks, then check the generated rules with a Rule Manager, so that you can have a general overview on the rules, count them and understand how they are structured, along with their features. This task has produced 64 rules, with a maximum condition number of 12.
- Add an Optimize Ruleset task, link it to the LLM Classification task and configure it as follows:
Minimum covering value (%): 5
Maximum number of conditions: 7
Maximum rule error (%): 10
Save and compute the task.
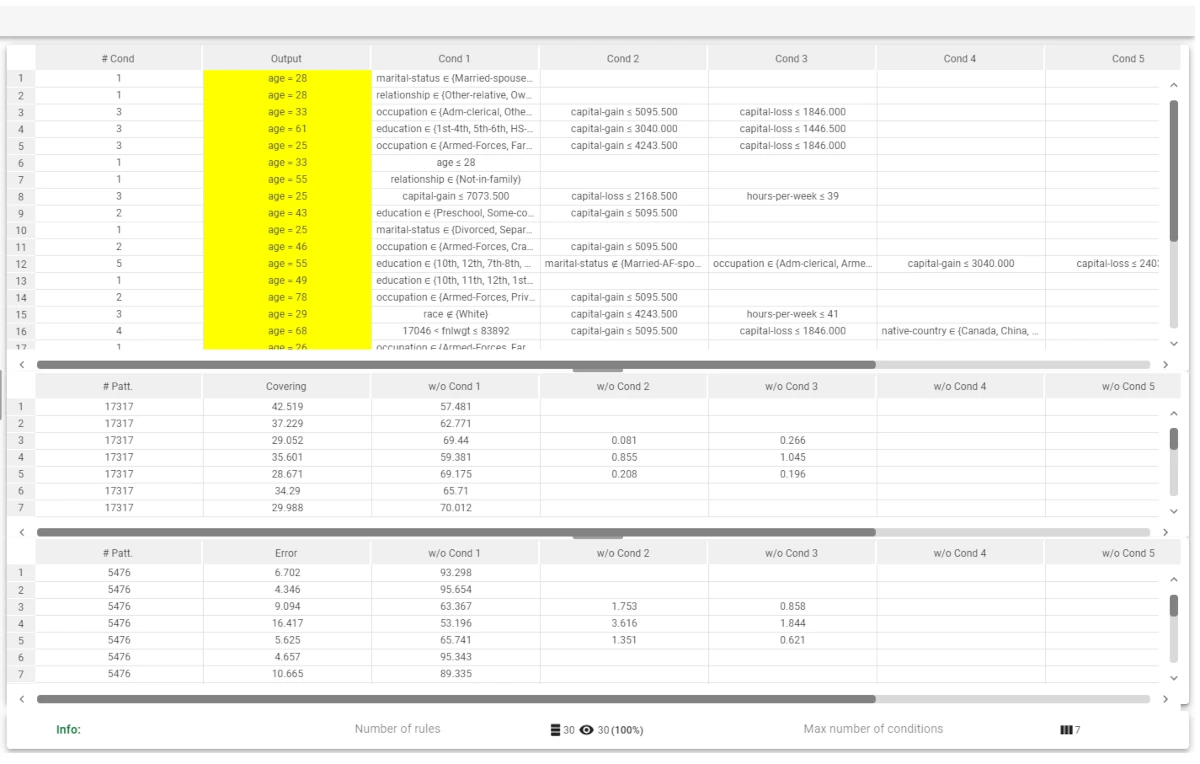
Add a Rule Manager task and link it to the Optimize Ruleset task to visualize the results. 30 rules satisfy the optimization constraints set.