Projection clustering
After having aggregated and filtered data, Rulex Factory allows users to perform a k-means clustering process. This process is made possible by using the Projection clustering (k-means) task.
This task is divided into four tabs:
The Options Tab, where users can choose the attribute they will work on and with.
The Monitor Tab, where users can view the properties of the new clusters.
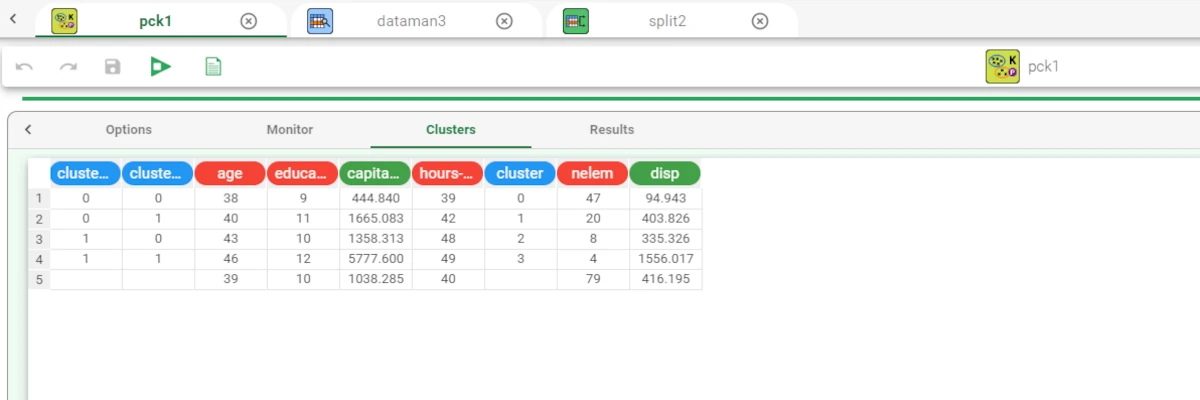
The Clusters Tab, where users can visualize the group created.
The Results Tab, where users can visualize the results.
The Options tab
The Options tab is divided into two tabs: the Basic tab and the Advanced tab.
In the Basic tab, users will find the following structure:
The Available attributes, where users will find the dataset’s attributes.
The Attributes drop area, where users can drag the chosen attributes.
Two Customization panes, where users are able to customize different options.
Available Attributes
Within this pane, users will find a list of all the dataset’s attributes. To search for a specific attribute, use the lens icon at the top right of the pane. Users also have the option of sorting the attributes according to their preferences.
They can choose from a drop-down list of the Order by option:
Attribute
Name
Type
Ignored
Role
Attribute Drop Area
The Attribute drop area contains the following options:
The Attributes to consider for clustering pane, where need to insert the attributes they want to use as input for creating their cluster computation. This operation can be done via a Manual List (users need to manually drag & drop the selected attributes onto the pane) or via a filtered list.
The Label attributes, where users can drag and drop the attributes that that will be considered as labels in the clustering computation.
Customization Panes
Clustering type. Through a drop-down list, users can choose between three different approaches for computing cluster centroids:
k-means, where the mean is used to compute the cluster centroid.
k-medians, where the median is used to compute the cluster centroid.
k-medoids, where the point of the dataset closest to the mean is used as the cluster centroid.
Clustering algorithm. Through a drop-down list, users can choose between three different clustering algorithms:
Standard, where cluster centroids are recomputed only after all the points have been reassigned;
Incremental, where cluster centroids are recomputed after each point moving;
Error-based, where point moving is decided by minimizing the error, instead of the distance from cluster centroid.
Distance method for clustering. Users can choose the method employed for computing distances between examples. Available methods are:
Euclidean
Euclidean (normalized)
Manhattan
Manhattan (normalized)
Pearson
Distance method for evaluation. Users can choose the method required for distance. Available methods are:
Euclidean
Euclidean (normalized)
Manhattan
Manhattan (normalized)
Pearson
Normalization for ordered variables. The type of normalization to use when treating ordered variables. Available options are:
None
Attribute
Normal
Minmax [0.1]
Minimax [-1,1]
Initial assignment for clusters. Procedure adopted for the initial assignment of points to clusters. Available options are:
Random
Smart
Weight-based
Number of clusters to be generated. The required number of clusters. The number of clusters cannot exceed the number of different examples in the training set.
Attribute for initial cluster assignment. Users can optionally select a specific attribute from the drop-down list, which will be used as an initial cluster assignment.
Attribute for weights. Users can optionally select an attribute from the drop-down list, which will be used as a weight in the clustering process.
In the Advanced tab, users will find the several advanced customization options. For more information, refer to the introductory Clustering tasks page.
The Monitor tab
Within this tab, users can view the properties of the new clusters.
The Monitor tab is divided into two tabs:
The Elements tab
The Dispersion tab
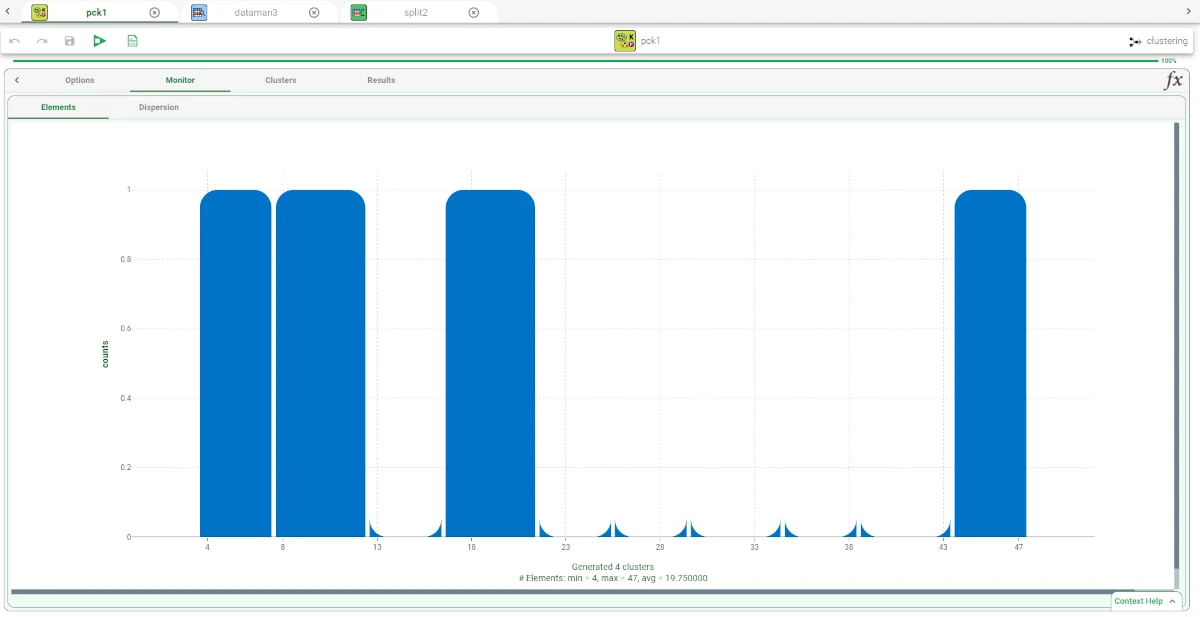
Elements tab
In the Elements tab, users can view a histogram displaying the number of elements.
On the X axis, users can visualize the Range.
On the Y axis, users will visualize the counts.
Information such as Count, Range, Percentage on tot, and Percentage on bat will be displayed by hoovering on one bar displayed in the tab.
Dispersion tab
Within the Dispersion tab, users can visualize a histogram displaying the number of dispersion.
On the X axis, users can visualize the Range.
On the Y axis, users will visualize the counts.
The Results tab
In the Results tab, users can visualize a summary of the results.
This tab is divided into two panes:
General Info
Within this pane, users can find the following information:
Task label
Elapsed time (sec)
Number of single samples
Average weigh of single samples
Number of clusters
Average dispersion of clusters
Dispersion of default cluster
Minimum number of points in a cluster
Maximum number of points in a cluster
Number of singleton clusters
PseudoF index (Calinski-Harabasaz criterion)
Relative PseudoF index
Davies-Bouldin index
Inter-cluster distance variance
Intra-cluster distance variance
Result Quantities
Within this pane, users can set and configure the following options:
Average dispersion
Average weight
Minimum dispersion
Number of distinct samples
Number of samples
All these checkboxes are checked by default.
On the right of the above-mentioned checkboxes, users, through a drop-down list, will be able to choose between the following options:
Train
Test
Valid
Whole
Example
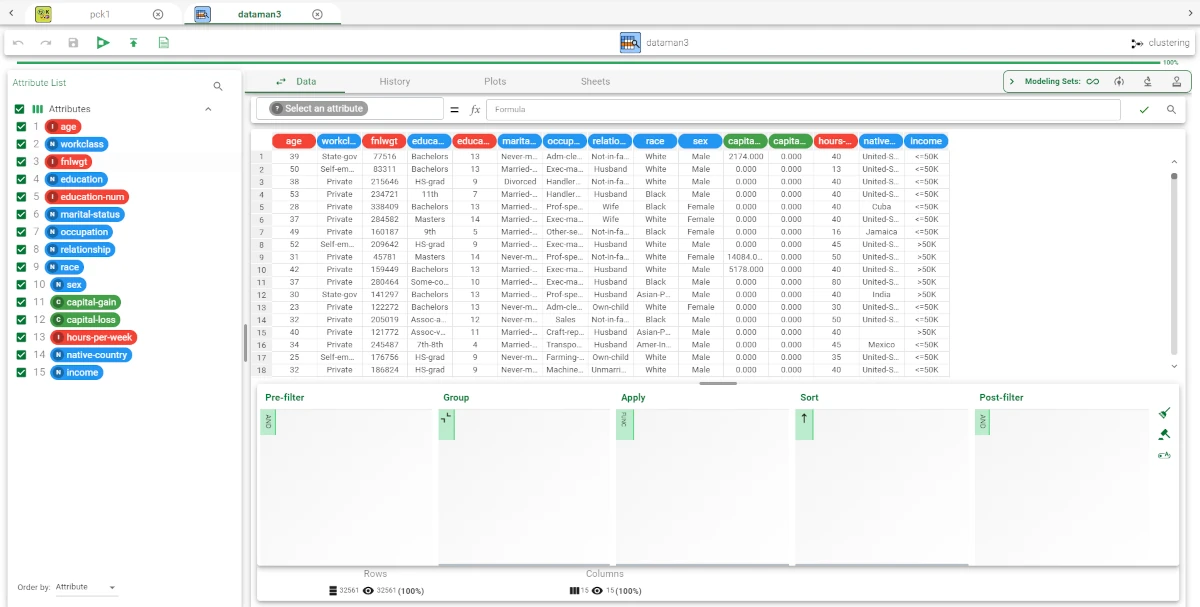
After having imported the selected dataset through an Import from Text file task, drag a Data Manager onto the stage and connect it to the task. Configure the task as explained above, then save and compute the task.
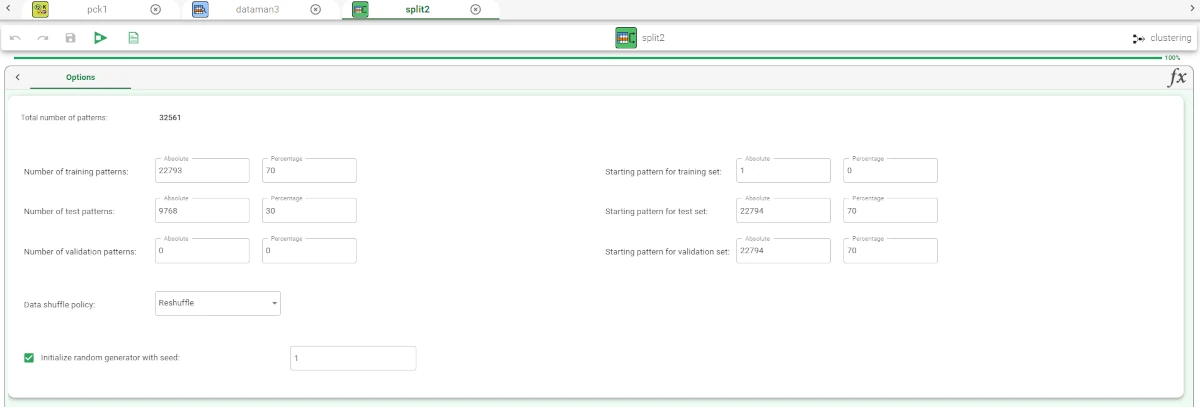
Drag a Split Data task onto the stage to randomly split the dataset into two subsets (test and training set; 30% test and 70% training) and connect it to the Data Manager. Save and compute the task. Then, drag a Projection Clustering (K-means) task onto the stage and link it to the Split Data task and configure it as explained in the sections above. Save and compute the task.
The properties and characteristics of the new generated clusters can be visualized in the Monitor tab and in the Clusters tab.