Changing the Plot Layout
You can modify the plot layout options through the Layout Options window.
To open the Layout Options window, you need to select the Open layout options entry in the context menu obtained by right-clicking on any point of your plot.
Prerequisites
You need to have a Data Manager opened
You need to have a plot already configured and drawn
Procedure
Right-click on any point of the considered plot.
Select the Open layout options in the provided context menu.
Change the layout configurations you want by moving through the three internal tabs: Plot, Axis, Legend. Any modifications except the tick format change is automatically previewed on the plot.
Click on Apply button to confirm your modifications or on Cancel to discard them.
Plot layout tab
In Plot layout tab you can change Plot general layout options, like fonts, font colors, margin size, background color and many other options.
The tab is divided into three areas controlling respectively:
Plot title
Plot backgrounds
Plot size and margins
In the Plot title area you can configure all the principal characteristics of the plot title. In particular:
Title text: the actual text of the title. If the text is empty the title is not drawn on the plot.
Title font family: the font family of the title.
Title font size: the font size of the title.
Title horizontal position (%): the horizontal position of the title expressed as a percentage between
0and1of the total plot width.0means a left aligned title while1means a right aligned title.Title font color: the font color of the title. It is controlled by a color picker. Follow the link for more information about color selector.
Note
Remember that subplots are considered as part of a unique plot. Therefore, title configured here is for the whole collection of subplots. If you want to draw two different plots with different title you need to use Page multi plot feature as explained in the plots tab overview.
In the Plot backgrounds area you can configure a possible color background for the two main areas composing the plot:
Background plot color: it is the background color assigned to the main plot area which is enclosed by the coordinate system, and it excludes eventual margins for ticks and labels.
Background paper color: it is the background for the whole widget area, comprehensive of margins and title.
Hint
Opacity of the background can be imposed in the associated Color picker to make plot background transparent, and to allow the user to see eventual widgets on background.
In the Plot size and margins area, you first need to decide if you want to use the Auto layout or the Custom one:
in Automatic layout, width and height of the plot as well as its internal margins are based on the dimension of the window and on the content of axis and plot. They therefore adapt to a change of the content or of the dimension of the window itself.
in Custom layout, all the plot dimensions are established by the user. They are frozen with respect to any change both in the content and in the external window dimension.
By selecting Custom you are free to specify pixel quantities for the following entries:
Width: the width of the plot.
Height: the height of the plot.
Margin top: the size in pixel of the top margin of the plot.
Margin bottom: the size in pixel of the bottom margin of the plot.
Margin left: the size in pixel of the left margin of the plot.
Margin right: the size in pixel of the right margin of the plot.
Padding: the amount of padding (in px) between the plot area and the axis lines.
Axis layout tab
In the Axis layout tab you are free to customize plot axis which in Rulex Platform are placed all around your plot area. Configurations can be applied to any of the four axis (left, top, right, bottom) for any of the subplots present in your plot separately. Change can be made for a single axis at the time or for a general subset of the available axis. To select the axis to be considered in the current modification, you can use the Axis subplot selector which is located on the top of the Axis layout tab.
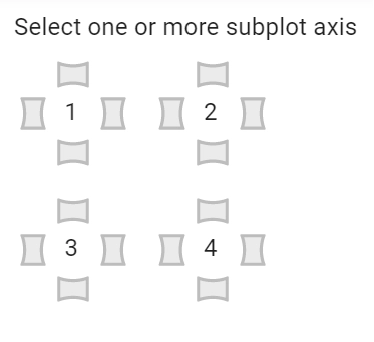
You have a four edge selector for any of the subplots present in your considered plot. By clicking on any of the four edge of a single selector, you are going to add that axis to the set of considered axis for the current selection. The lower side of the tab will be filled with the value present in that particular axis.
Note
If more than one axis is considered at the same time, only fields which present common value among all the considered axis for a particular option will be filled. A default value will be shown for the rest.
Once you have selected at least one axis, two different tabs will be shown in the area below the Axis subplot selector:
Label - Grid tab
Tick tab
In the Label-Grid tab, you can control two different aspects of the axis: Axis label and Grid lines. In the Axis label area you will modify the label assigned to the selected axis. In particular:
Axis label text: the actual text of the axis label. If the text is empty no label is drawn on the considered axis.
Axis label font family: the font family of the axis label.
Axis label font size: the font size of the axis label.
Axis label font color: the font color of the axis label. It is controlled by a color picker. Follow the link for more information about color selector.
In the Grid lines area you will decide if you want to draw grid lines on the plot area to separate the various tick intervals. Selecting Show or Hide in the radio button you will turn on/off grid lines for the considered axis. If grid lines are turned on you can further specify its properties:
Grid line width: the width of the grid lines.
Grid line color: the color of the grid lines.
In the Tick* tab, you are able to configure tick and labels on tick for the considered axis. Even this tab is divided in separated areas: Tick labels and Tick markers. In the Tick labels area you can modify the form and the format of the labels appearing on the axis tick. You can also decide to turn completely off the draw of tick labels by selecting Hide in the radio button presented at the top of this area. If you are showing tick labels you can further specify:
Tick font family: the font family of the tick labels.
Tick font size: the font size of the tick labels.
Tick font color: the font color of the tick labels. It is controlled by a color picker. Follow the link for more information about color selector.
Tick format: the tick format applied to the tick labels. This format entry allows the user to customize the label obtained from the actual value controlling the way it has to be constructed. Further information about how this format strings must be written are contained below.
Tick angle: the angle of the tick labels with respect to the vertical expressed as a number of degrees in the range
-90,90. The default valueautocan be used to leave to the system the decision of the right angle according to tick labels overall length.
Note
Tick label format follows d3 formatting mini-languages:
In the Tick markers area you can configure position and properties of the axis ticks. First, you can control if ticks must be shown and in which position by using the Hide, Inside, Outside radio button entries. If Hide entry is not selected, you can further specify:
Tick length: the length (in px) of the base axis tick.
Tick width: the width (in px) of the base axis tick.
Tick color: the color of the base axis tick. It is controlled by a color picker. Follow the link for more information about color selector.
Legend layout tab
In the Legend layout tab you can customize properties of the plot legend as well as modify the single trace names. The plot legend is automatically displayed if more than one trace is present among the different subplots. Multiple traces are drawn if a target attribute is present in one of the target dimension such as Color or Style. Explicit targets dimension for each plot type are list in the single plot pages.
First, user can choose if legend has to be drawn by using the dedicated Show, Hide radio button located at the top of the Legend layout tab. If legend box is drawn, the below panel is populated with different configuration areas, each controlling a different aspect of the legend box.
Areas present on the panel are respectively: Legend title, Box, Trace text and Legend trace names:
Note
Remember that subplots are considered as part of a unique plot. Therefore, title configured here is for the whole collection of subplots. I If you want to draw two different plots with different title you need to use Page multi plot feature as explained in the plots tab overview.
In the Legend title area, you can customize the title associated with the whole legend box:
Legend title text: the actual text of the legend box title. If the text is empty the legend box title is not drawn on the plot.
Legend title font family: the font family of the legend box title.
Legend title font size: the font size of the legend box title.
Legend title font color: the font color of the legend box title. It is controlled by a color picker. Follow the link for more information about color selector.
Note
Remember that subplots are considered as part of a unique plot. Therefore, a unique legend box is drawn for the whole collection of subplots. If different input attribute groups are used in a target dimension, resulting traces will be grouped as well inside the overall legend box to reflect the input configuration. If you want to draw two different plots with different legend boxes you need to use Page multi plot feature as explained in the plots tab overview.
In the Box title area, you can modify the layout of the legend box:
Border width: the width of the legend box border. A
0value means no border.Border color: the color of the legend box border. It is controlled by a color picker. Follow the link for more information about color selector.
Background color: the color of the legend box background. It is controlled by a color picker. Follow the link for more information about color selector.
In the Trace text area, you can control the layout of the single trace entries. In particular:
Trace text font family: the font family of the single trace legend entry.
Trace text font size: the font size of the single trace legend entry.
Trace text font color: the font color of the single trace legend entry. It is controlled by a color picker. Follow the link for more information about color selector.
In the Legend trace names area, you can finally customize single trace name by modifying them in the automatic generated list presented below the area subtitle.